eprofiler-tui
Share on:
Enter Your Mastodon Instance
Copy the link below to share to Mastodon
https://terminaltrove.com/eprofiler-tui/
A terminal based flamegraph viewer for OTLP and gRPC profiling data.
Script Preview
Review this script before executing in your terminal.
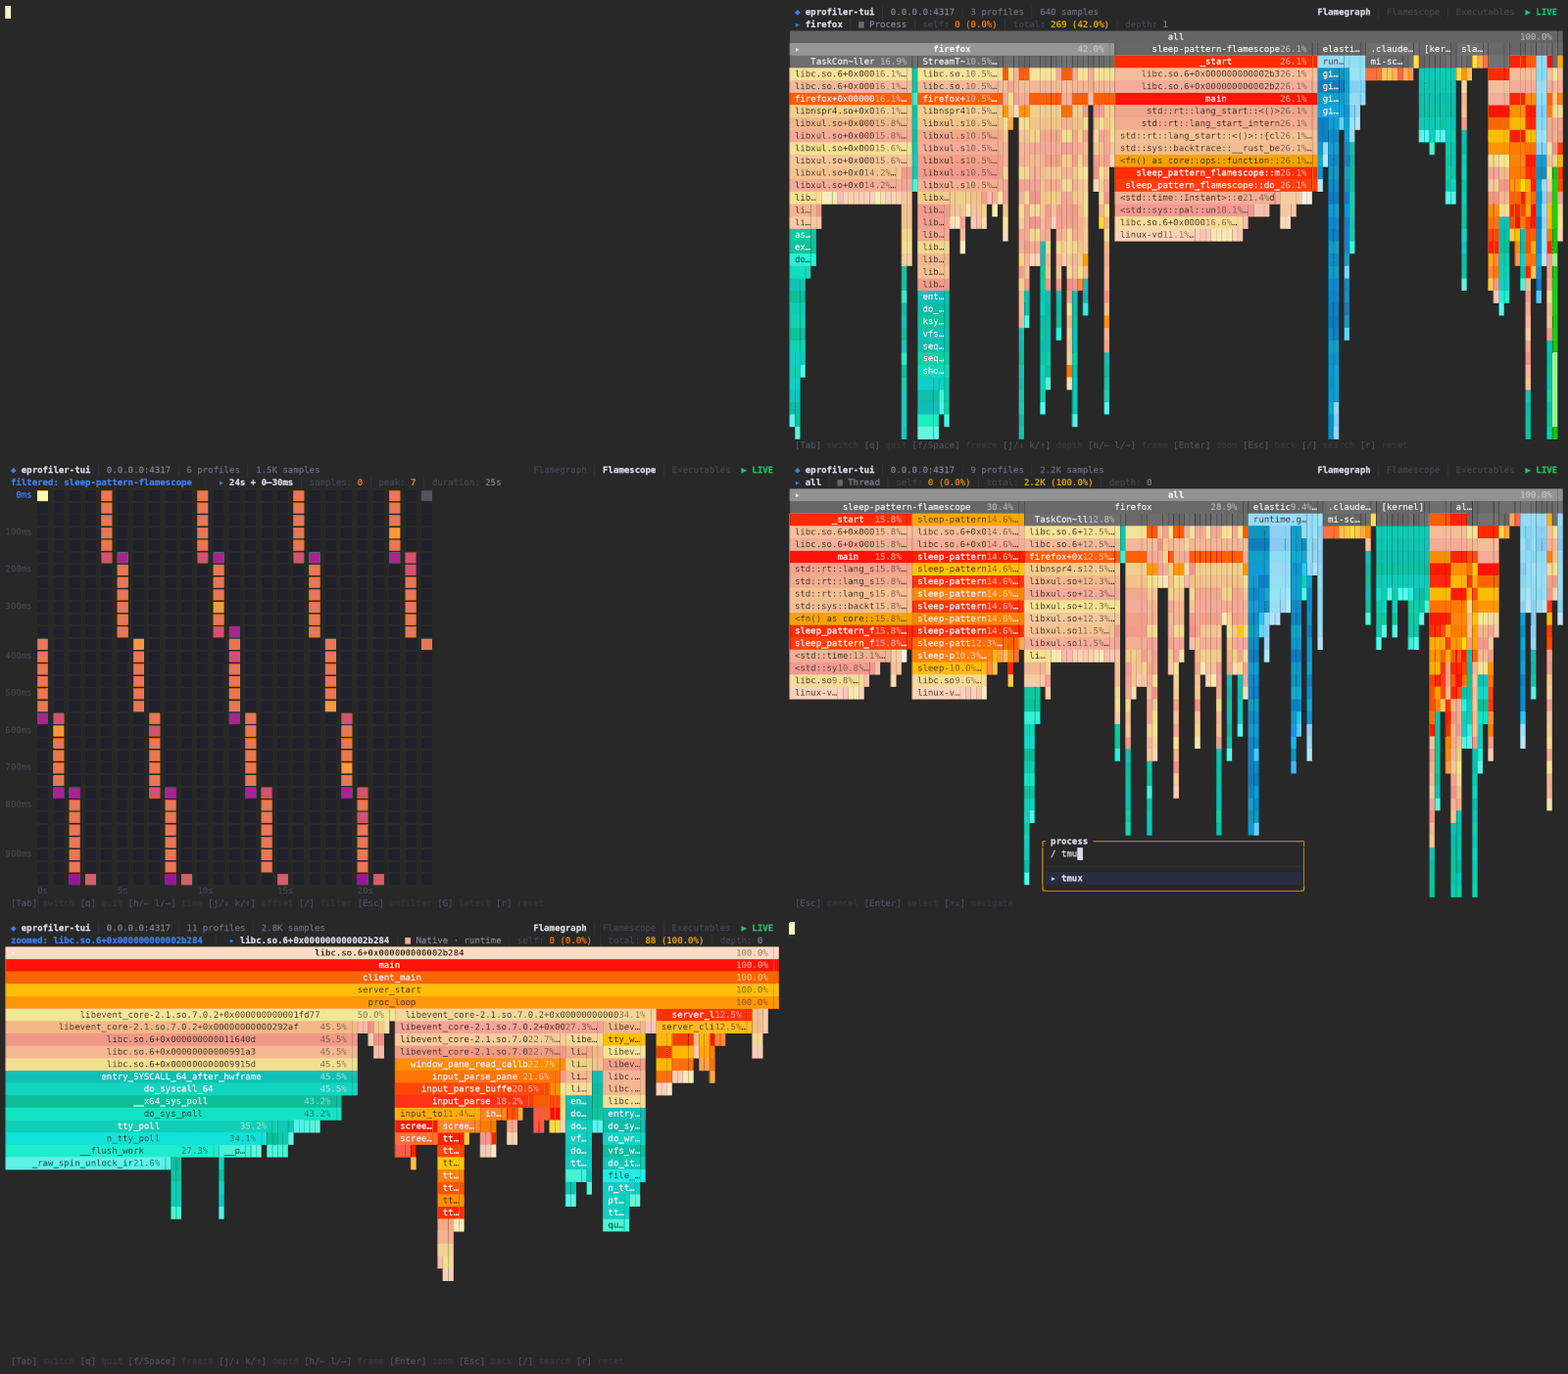
eprofiler-tui is a terminal-based flamegraph viewer for live OpenTelemetry (OTEL) and gRPC profiling data.
It receives profiling data via an OTLP gRPC endpoint and it displays a flamegraph-style of sampled call stacks. When displaying traces, it has three sections for viewing profiling information alongside the standard flamegraphs, flamescopes that help show time-based variance in flamegraph data, and executables that assist with symbolication from binaries with debug information.
The types of code eprofiler-tui can trace range from native code, kernel code and JVM code with samples grouped by its thread or process. A separate debug mode displays incoming profile requests as paginated records including detailed information such as resource attributes, function tables and resolved sample stacks. eprofiler-tui supports vim style key-bindings which allows for ease of navigate of the flamegraph stack information and it can zoom into frames and search for threads.
This tool can be used by developers who specialize in DevOps, SRE, backend and infrastructure settings that need to investigate application services using OpenTelemetry that require tracing and that need inspection for time critical, performance related work or regressions.