syswatch
Share on:
Enter Your Mastodon Instance
Copy the link below to share to Mastodon
https://terminaltrove.com/syswatch/
A single-host system diagnostics TUI.
Script Preview
Review this script before executing in your terminal.
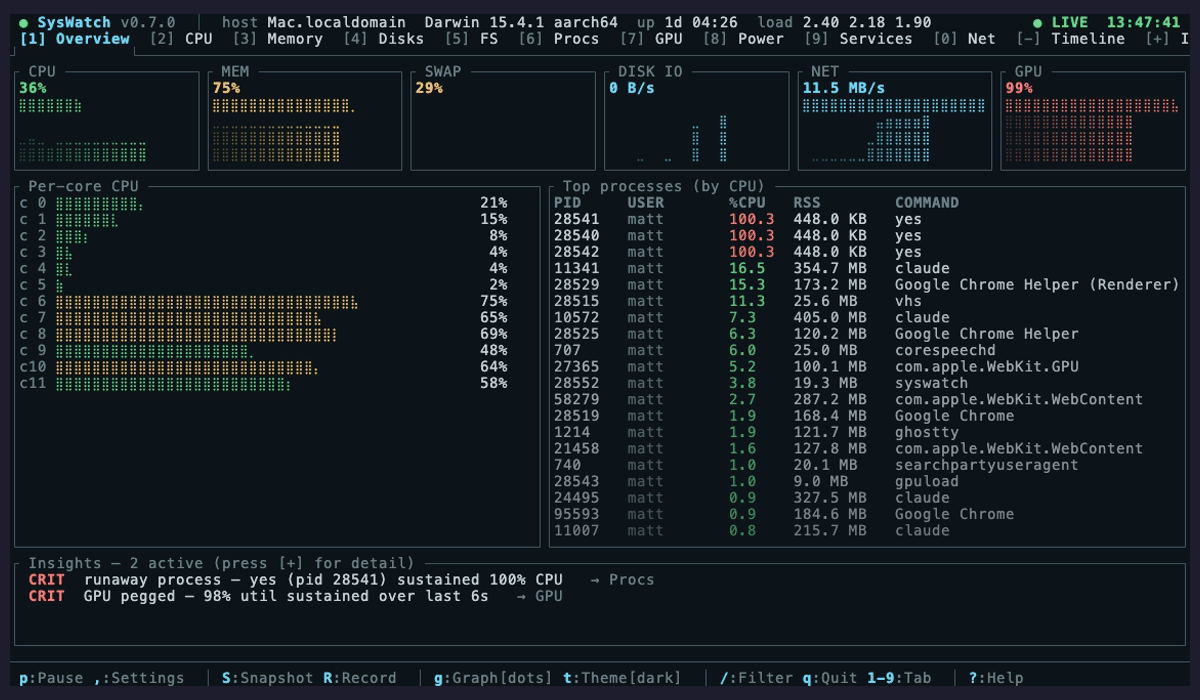


syswatch is a detailed single-host system diagnostics TUI for monitoring the internals of a running machine in your terminal.
It closely monitors system information such as the CPU, memory, disks, filesystems, processes, GPU, power and network statistics. It shows a graph timeline of the CPU/GPU and per-core utilization, and the aggregate CPU usage. Graphs of the machines temperature and power readings are available without root.
This tool is also able to monitor specific system events in the insights section which is configurable with settings to trigger events when certain filters and rules are met. It also works for process filtering, sorting, pause, tick-rate control, and allows you to record your system monitor and replay sessions.
syswatch is targeted towards software engineers, sysadmins, DevOps, homelab users and enthusiasts who need an all in one advanced system monitoring tool with lots of customizable features beyond or combining the capabilities of btop, htop and nvitop.