Terminal Resource Monitors
A resource monitor watches one part of a machine closely instead of summarizing all of it: GPU utilization and video memory, power draw and temperature, swap, disk throughput, or the bandwidth a single process is using.
These are what you reach for once a whole-machine dashboard has told you roughly where the problem is. A general monitor shows the load average climbing; a resource monitor shows which GPU is saturated, which link is full, or how much swap is left before the machine starts thrashing. Most redraw every second or two, so they work over an SSH session on a remote box as well as they do on a laptop.
Full screen dashboards that cover the whole machine at once, such as htop and btop, are under system monitors, and tools that collect metrics over time are under monitoring.
Below is a list of terminal tools that monitor a single system resource.
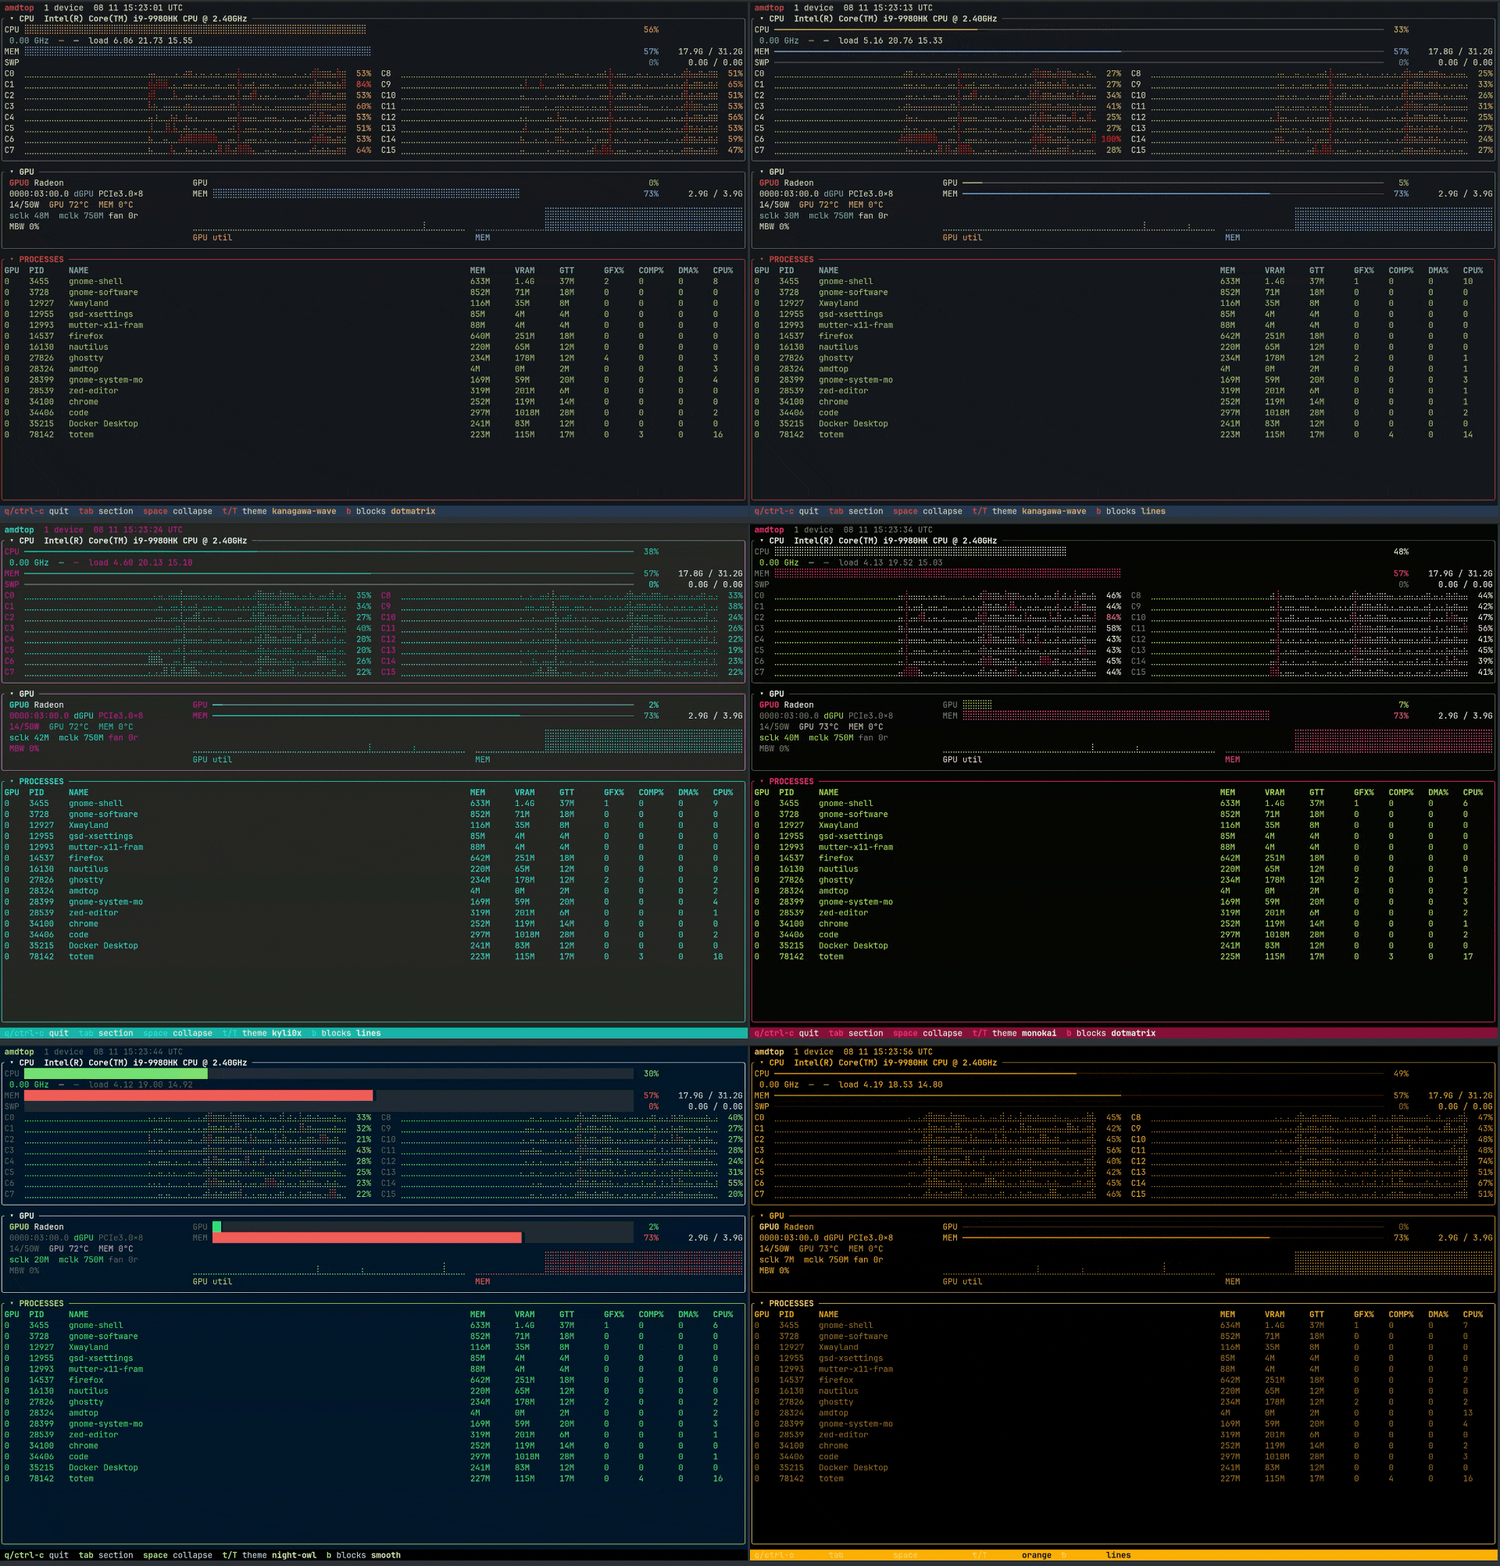
A TUI system monitor specialized for AMD GPUs.
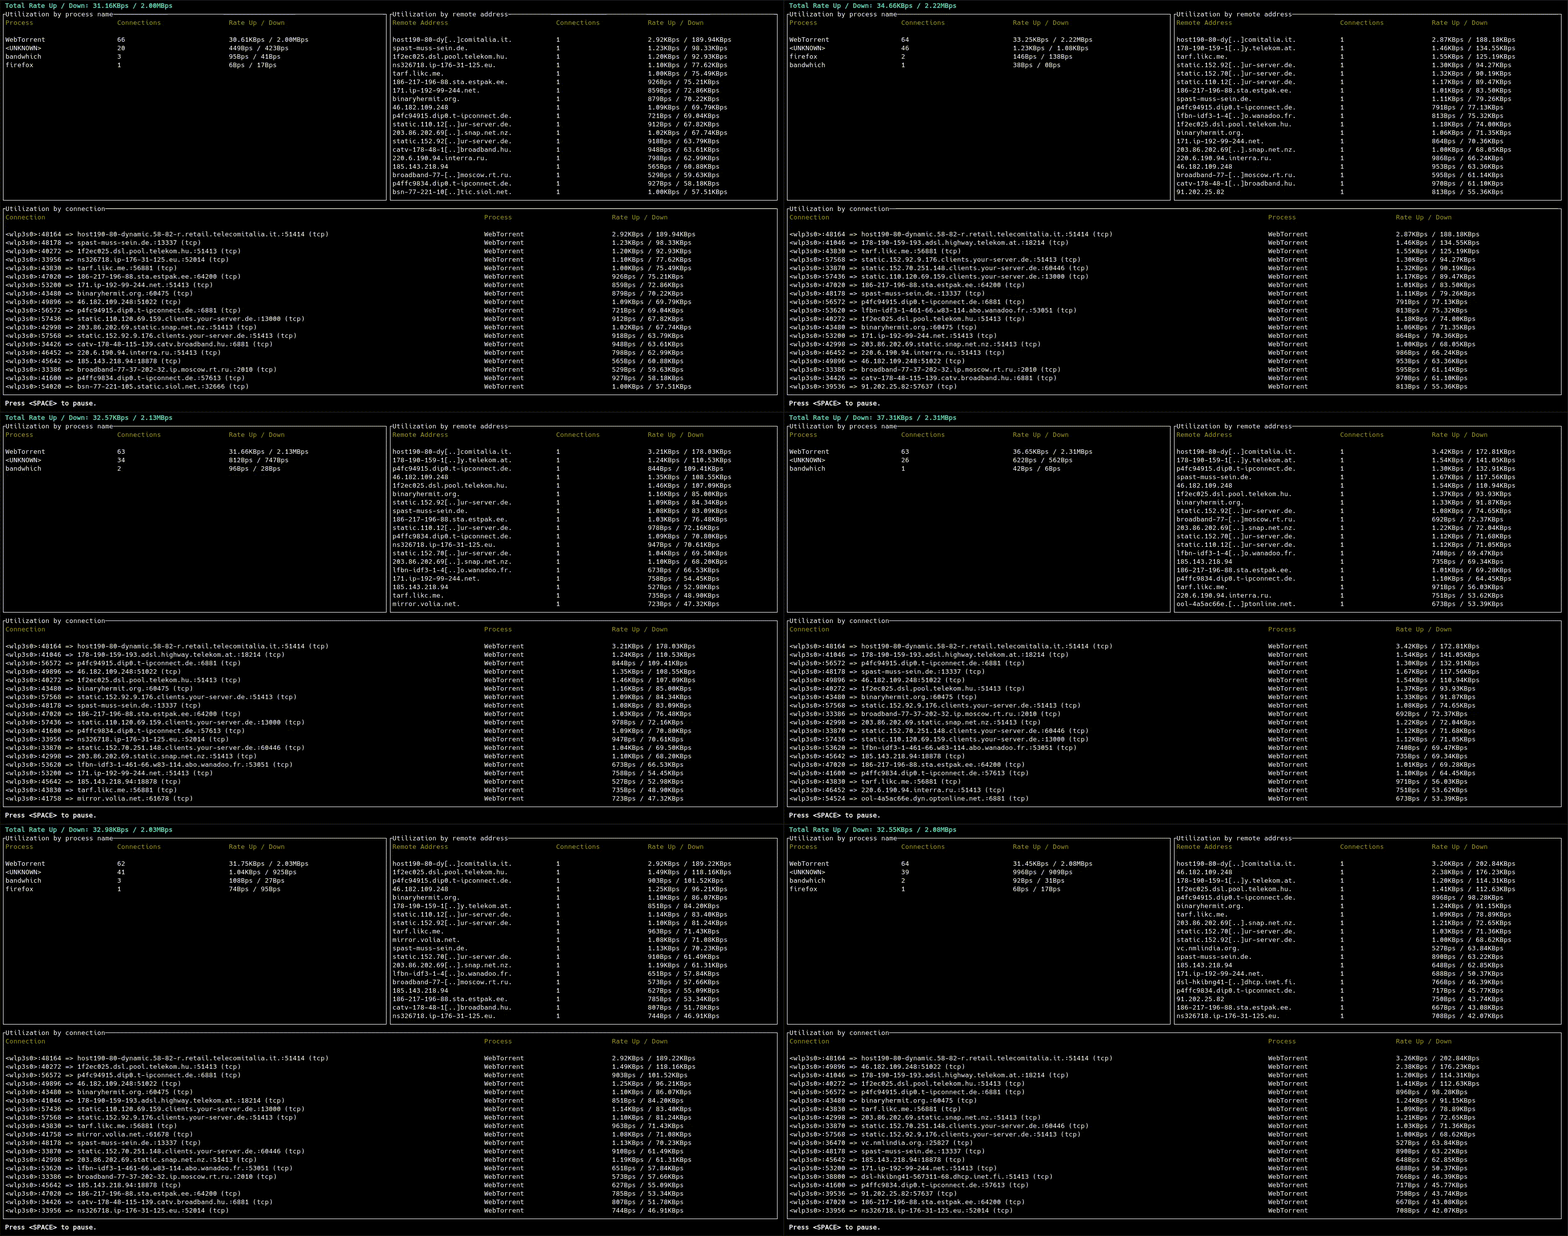
Terminal bandwidth utilization tool
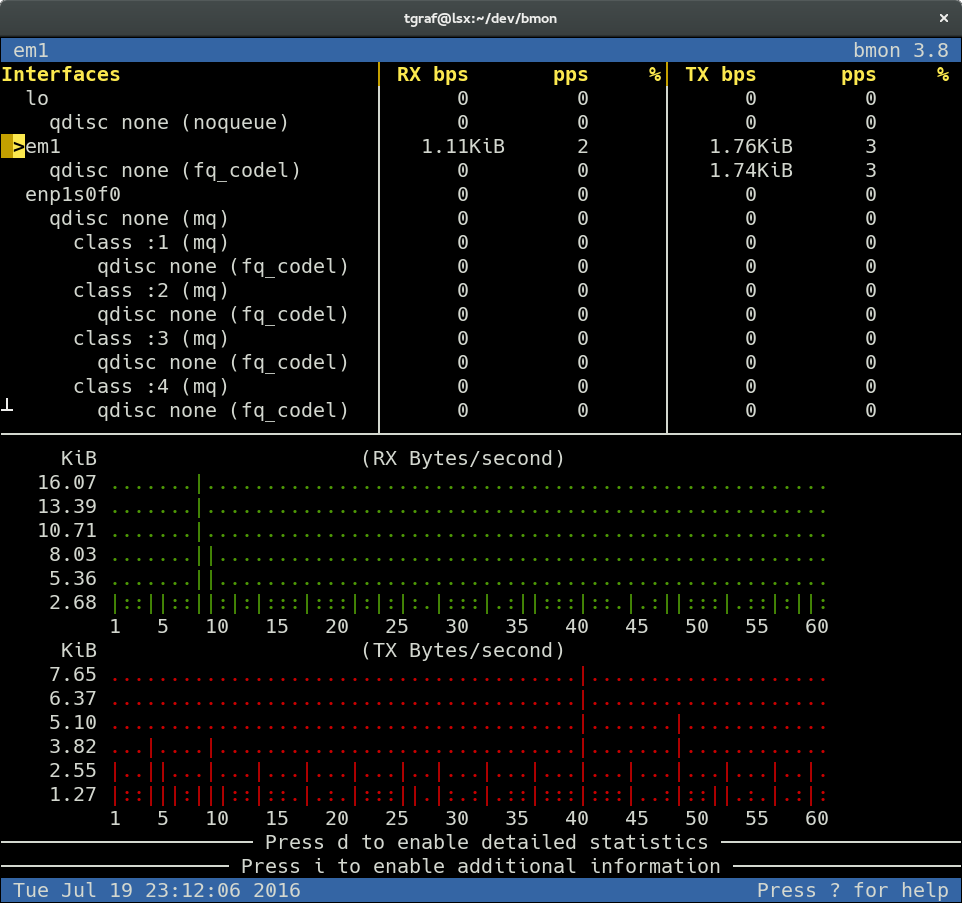
Bandwidth monitor and rate estimator
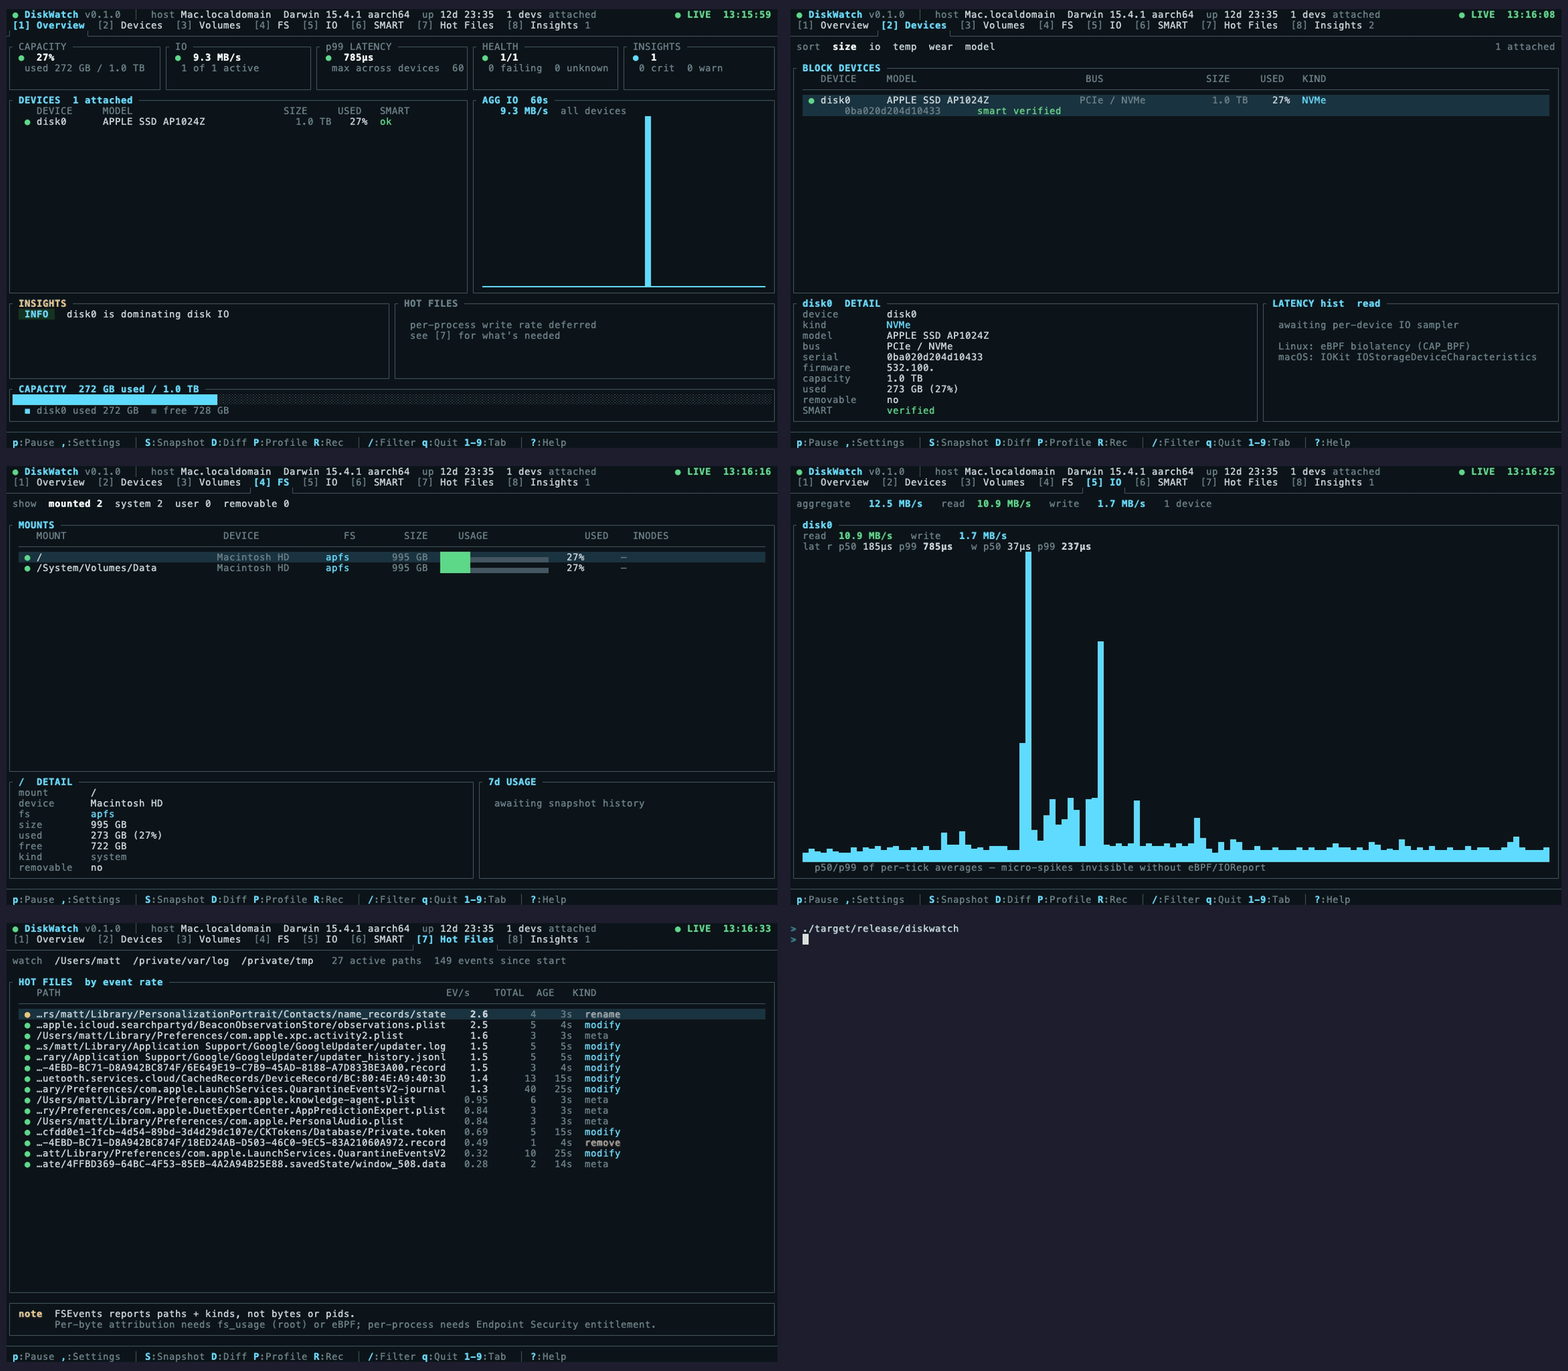
Single host disk diagnostics in your terminal.
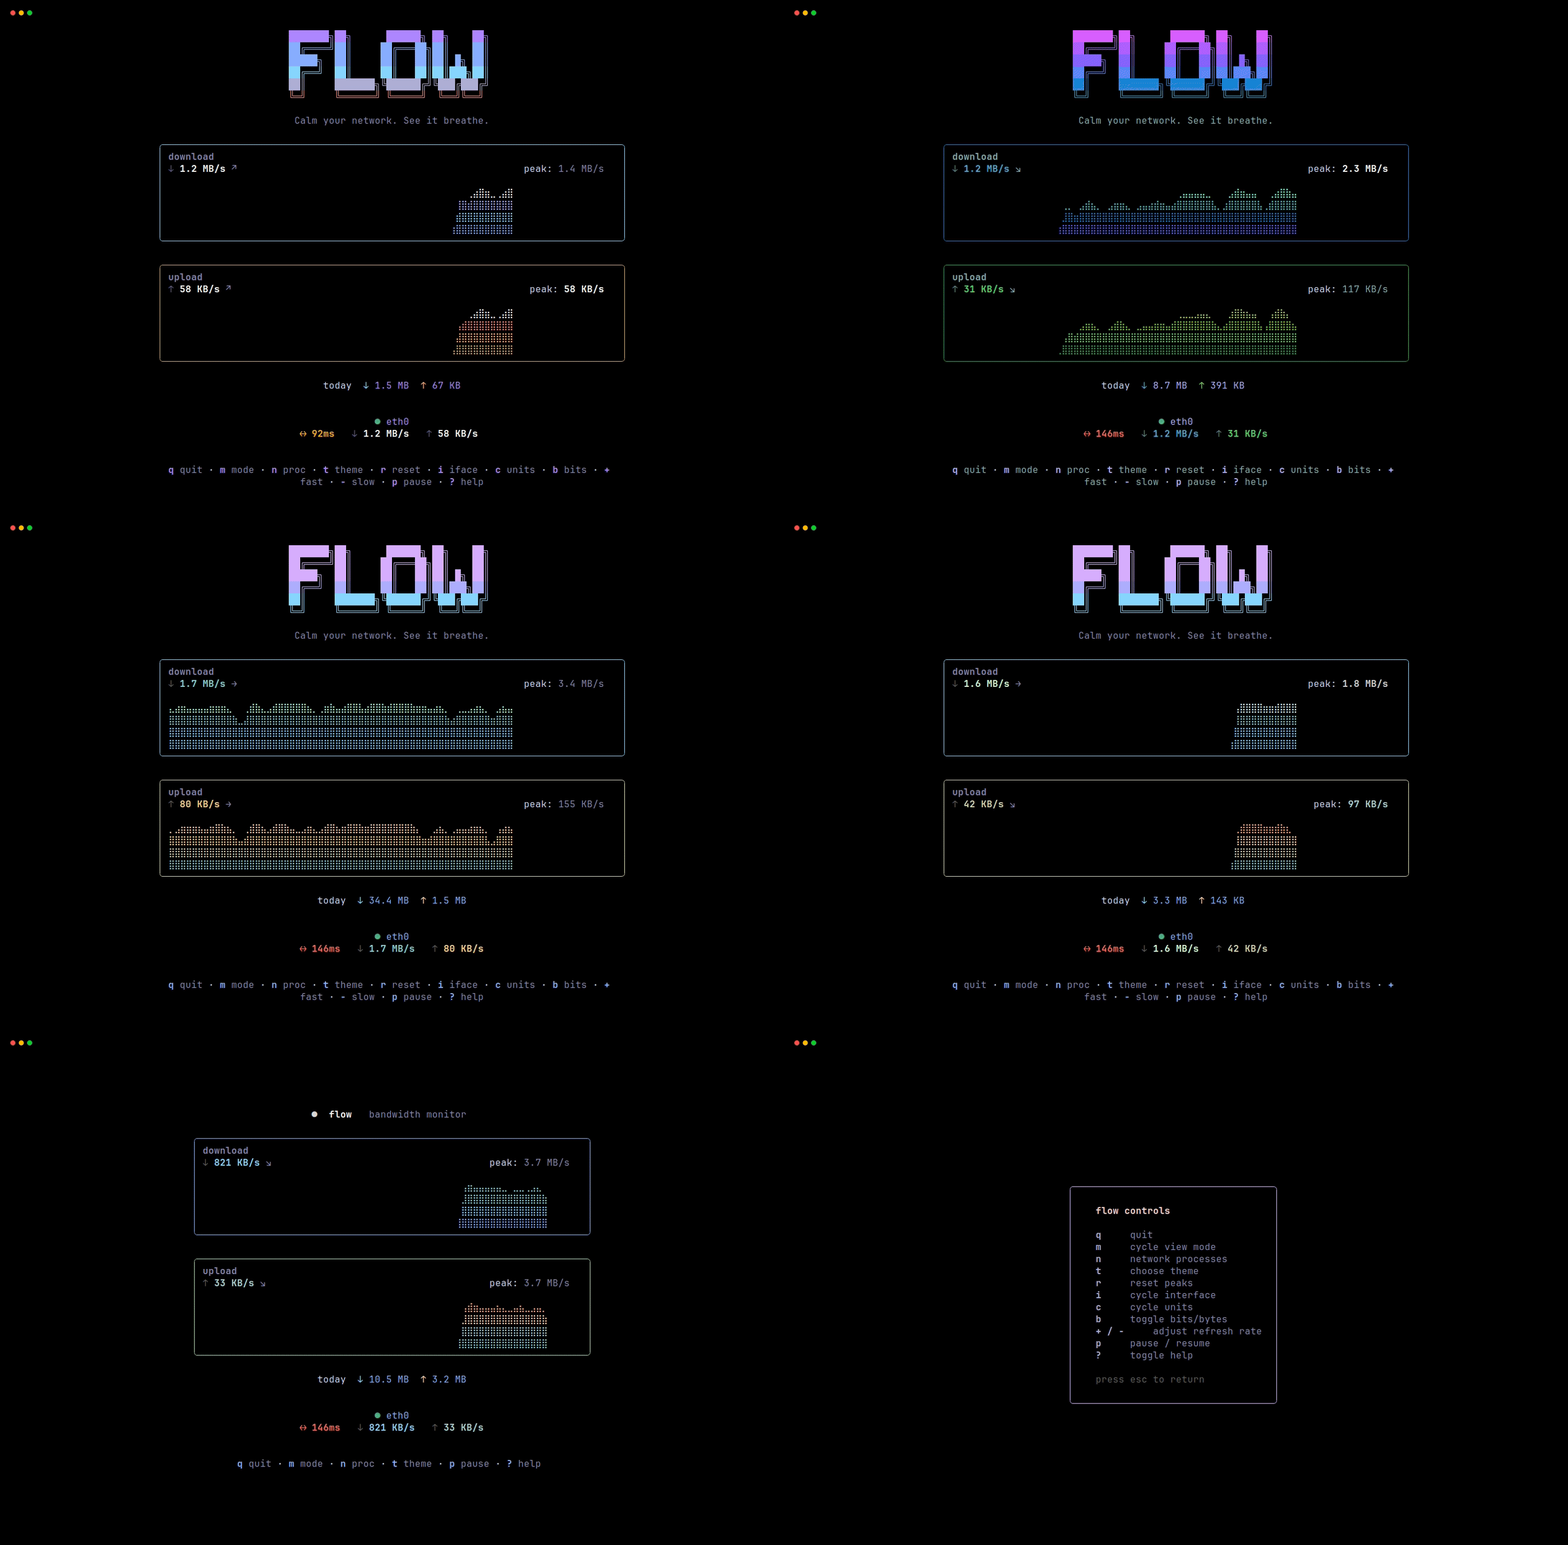
Real-time network throughput dashboard for the terminal.
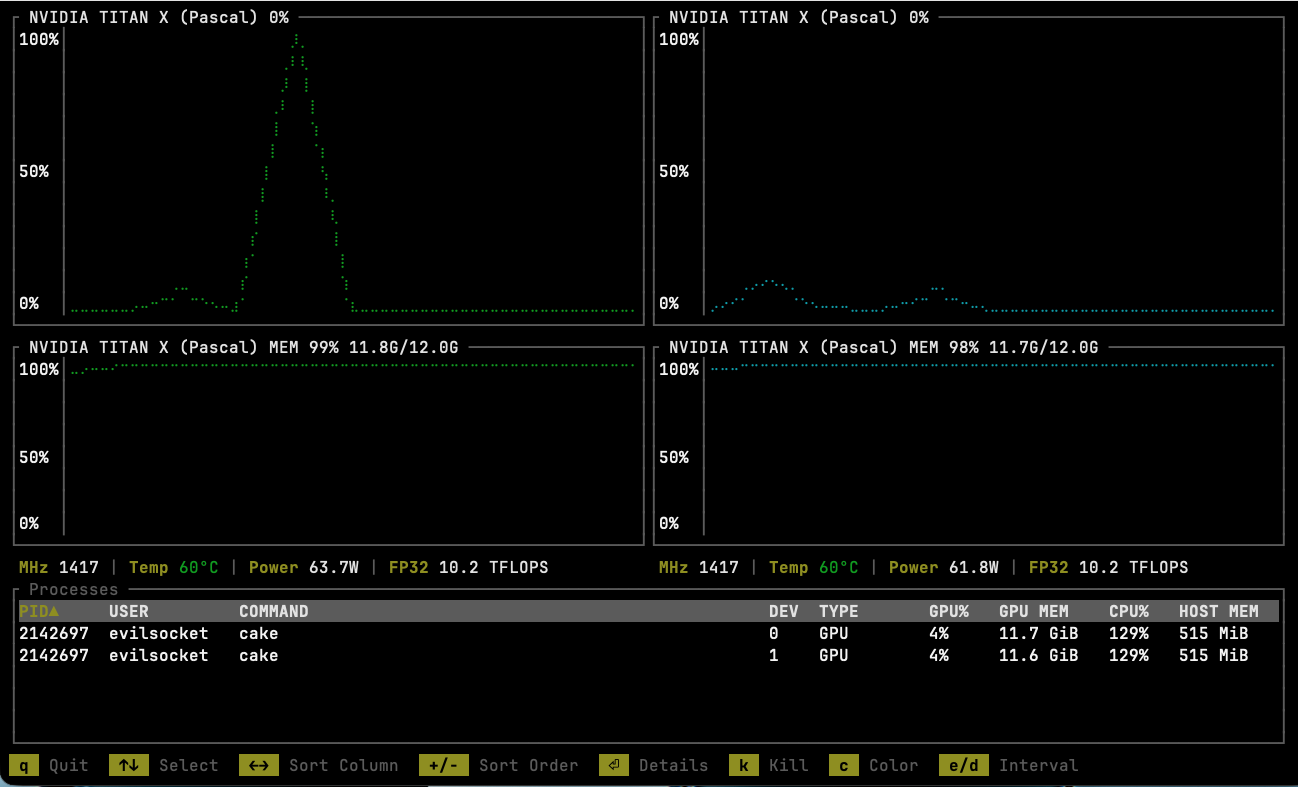
A TUI GPU monitor with support for both Apple Silicon and NVIDIA GPUs.
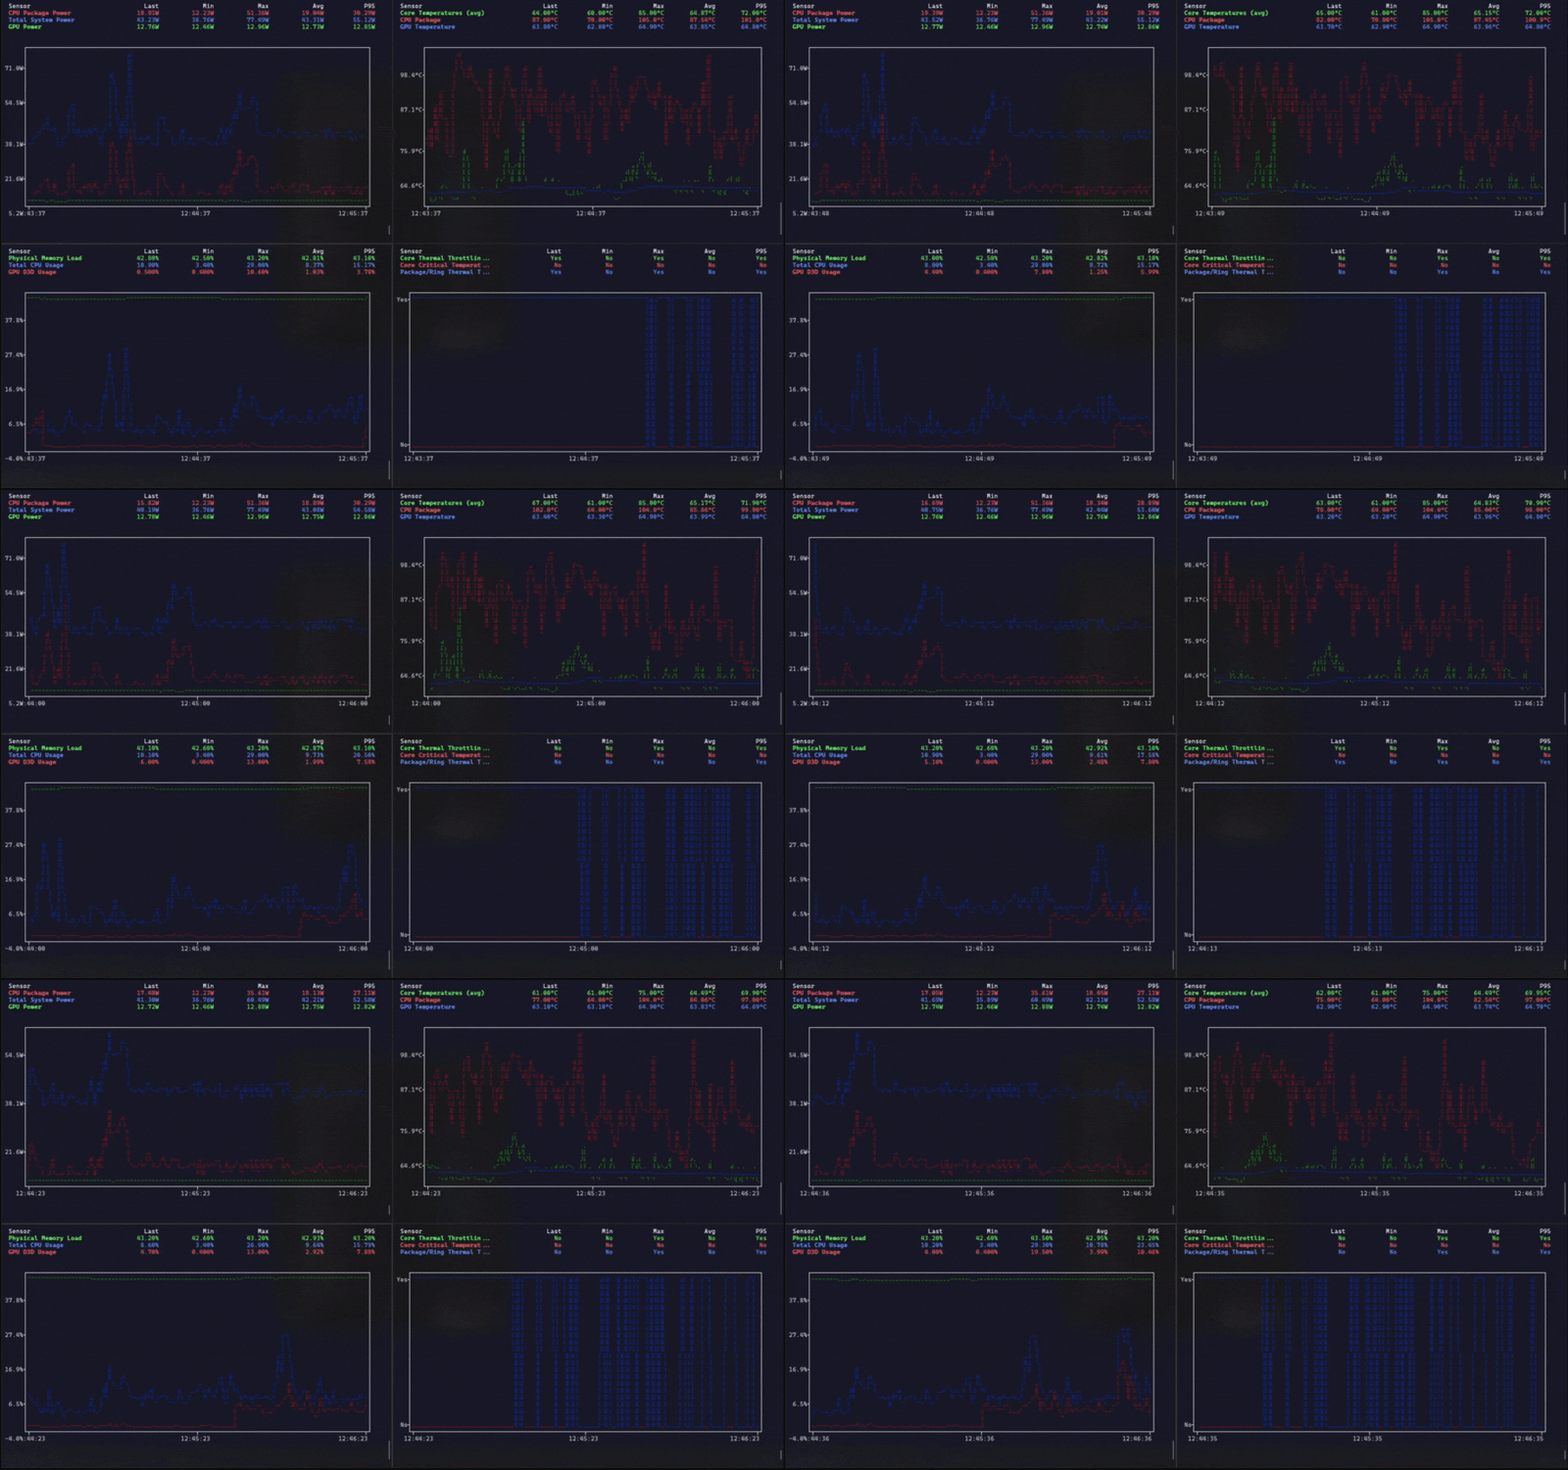
A terminal visualization tool for monitoring real-time hardware sensor data from HWInfo.
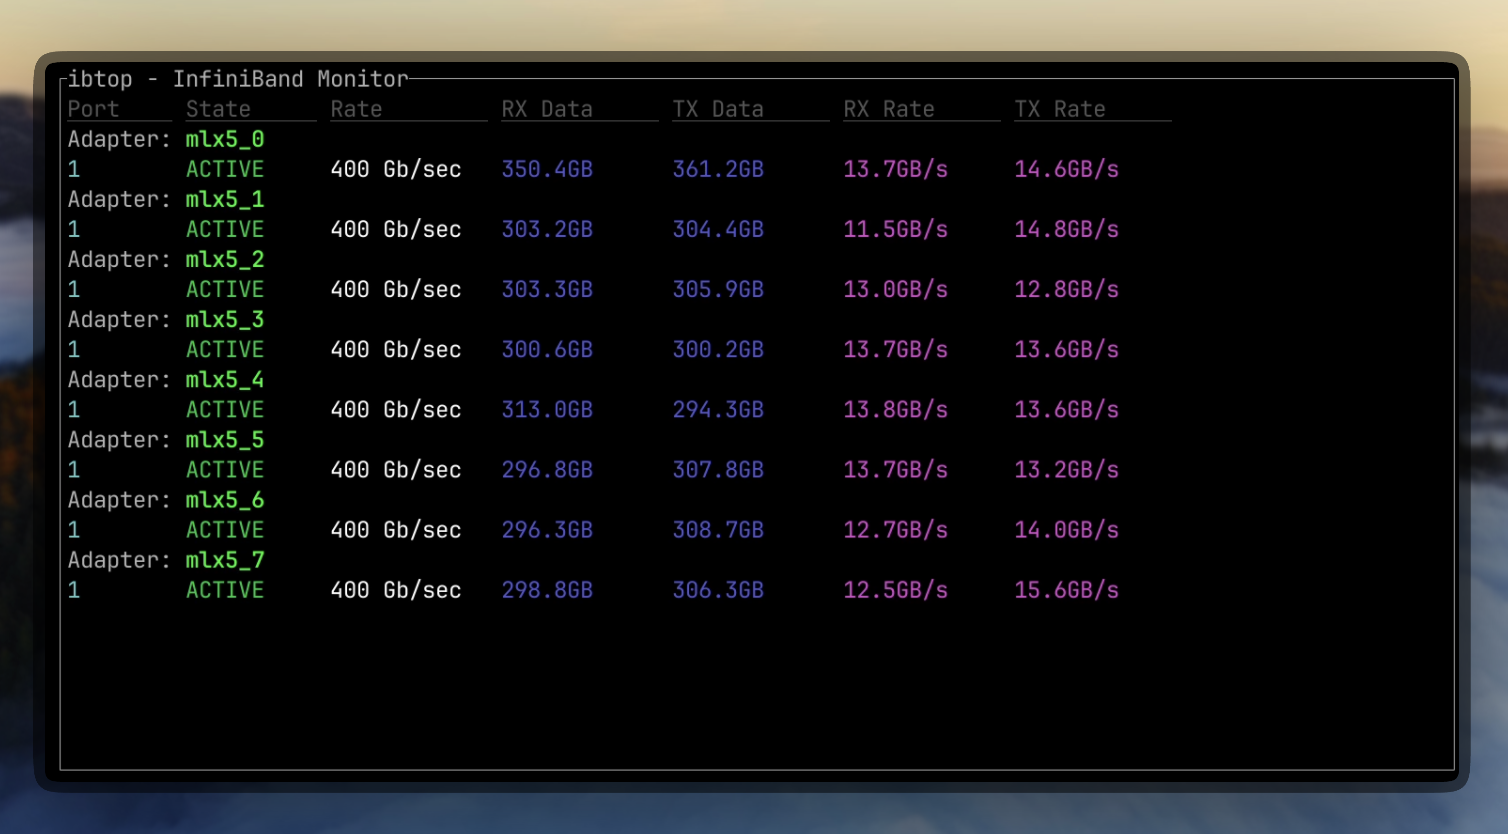
Real-time terminal monitor for InfiniBand networks.

A beautiful TUI battery and energy monitor for your terminal.
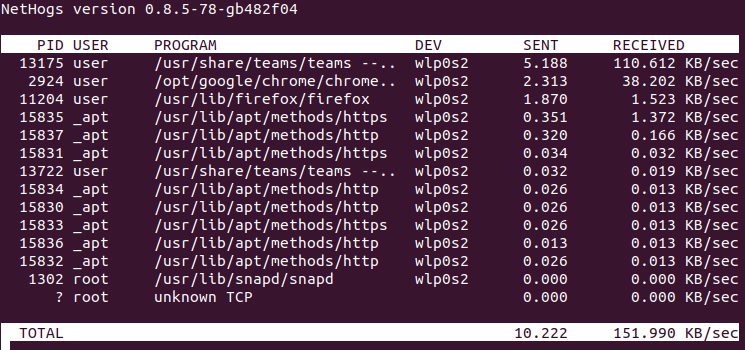
A linux 'net top' tool.
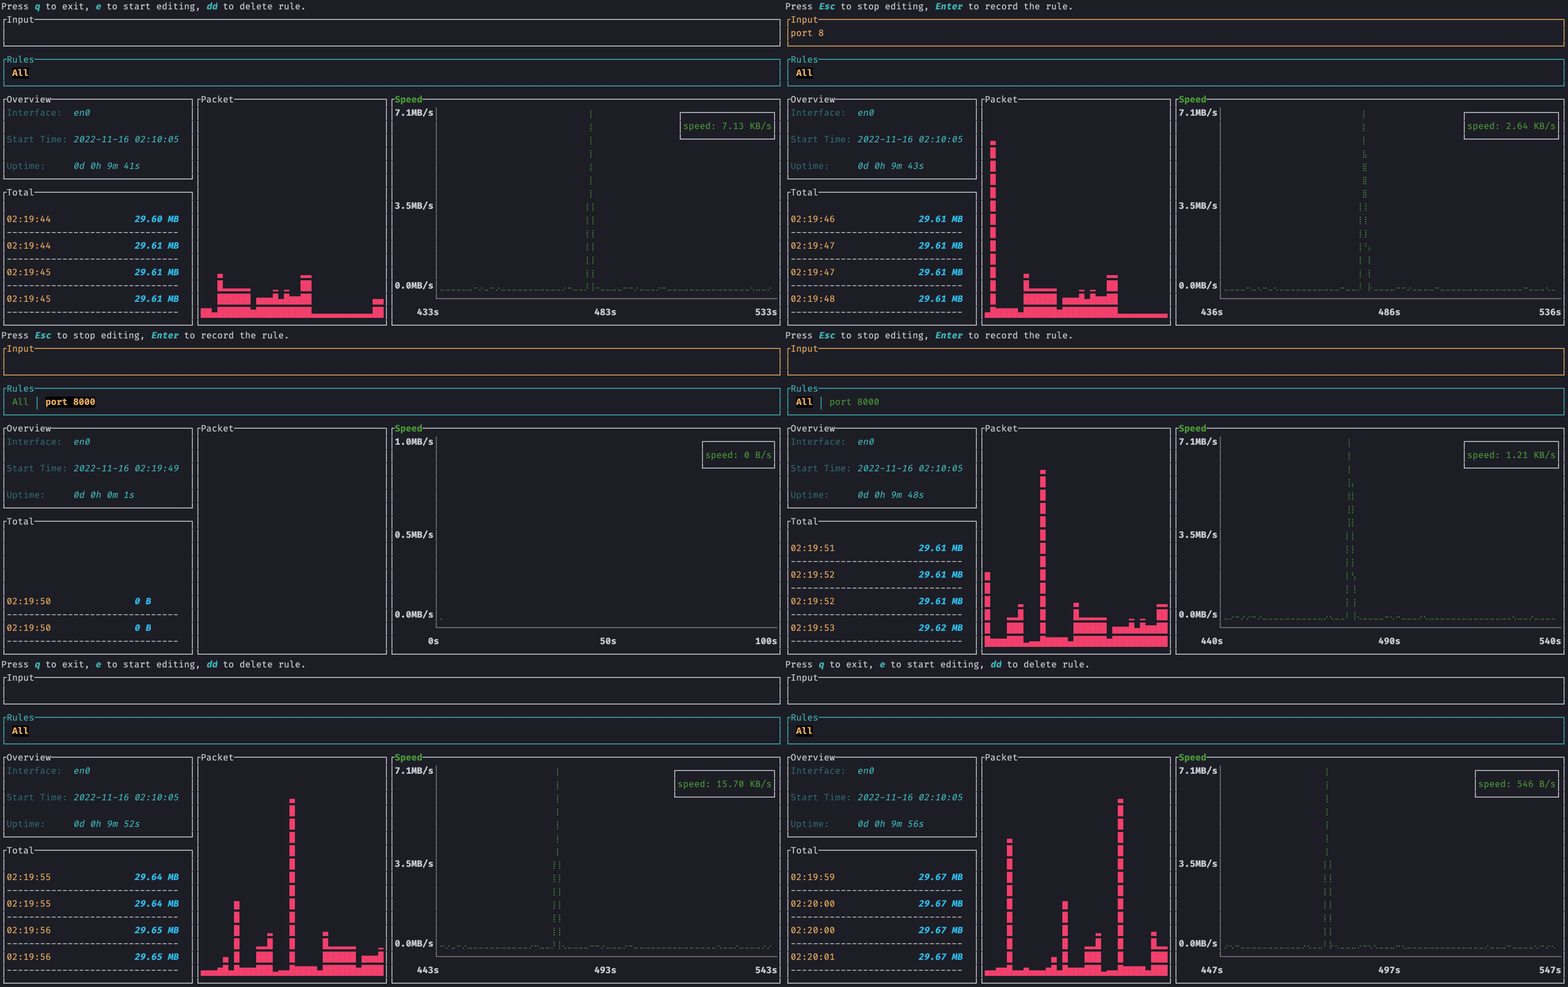
A network topology visualizer.
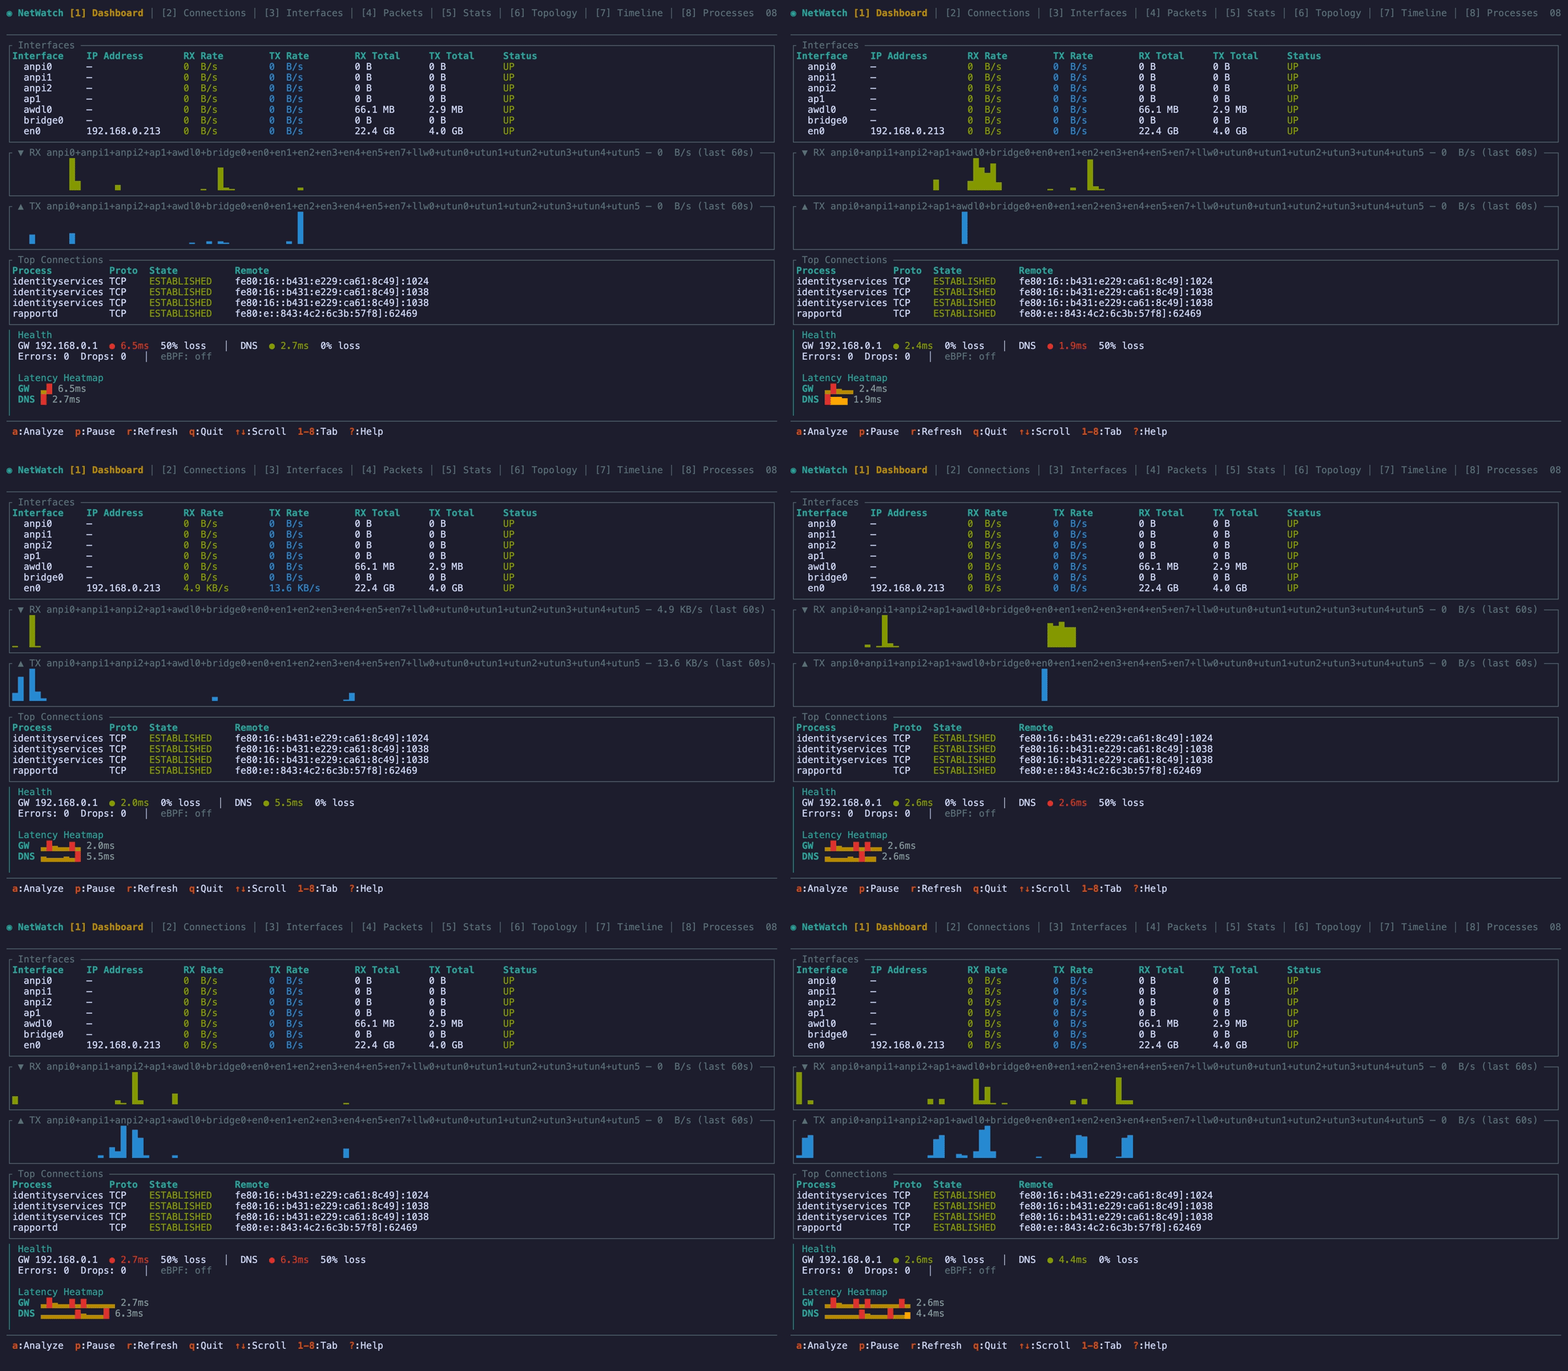
Real time network diagnostics in your terminal.
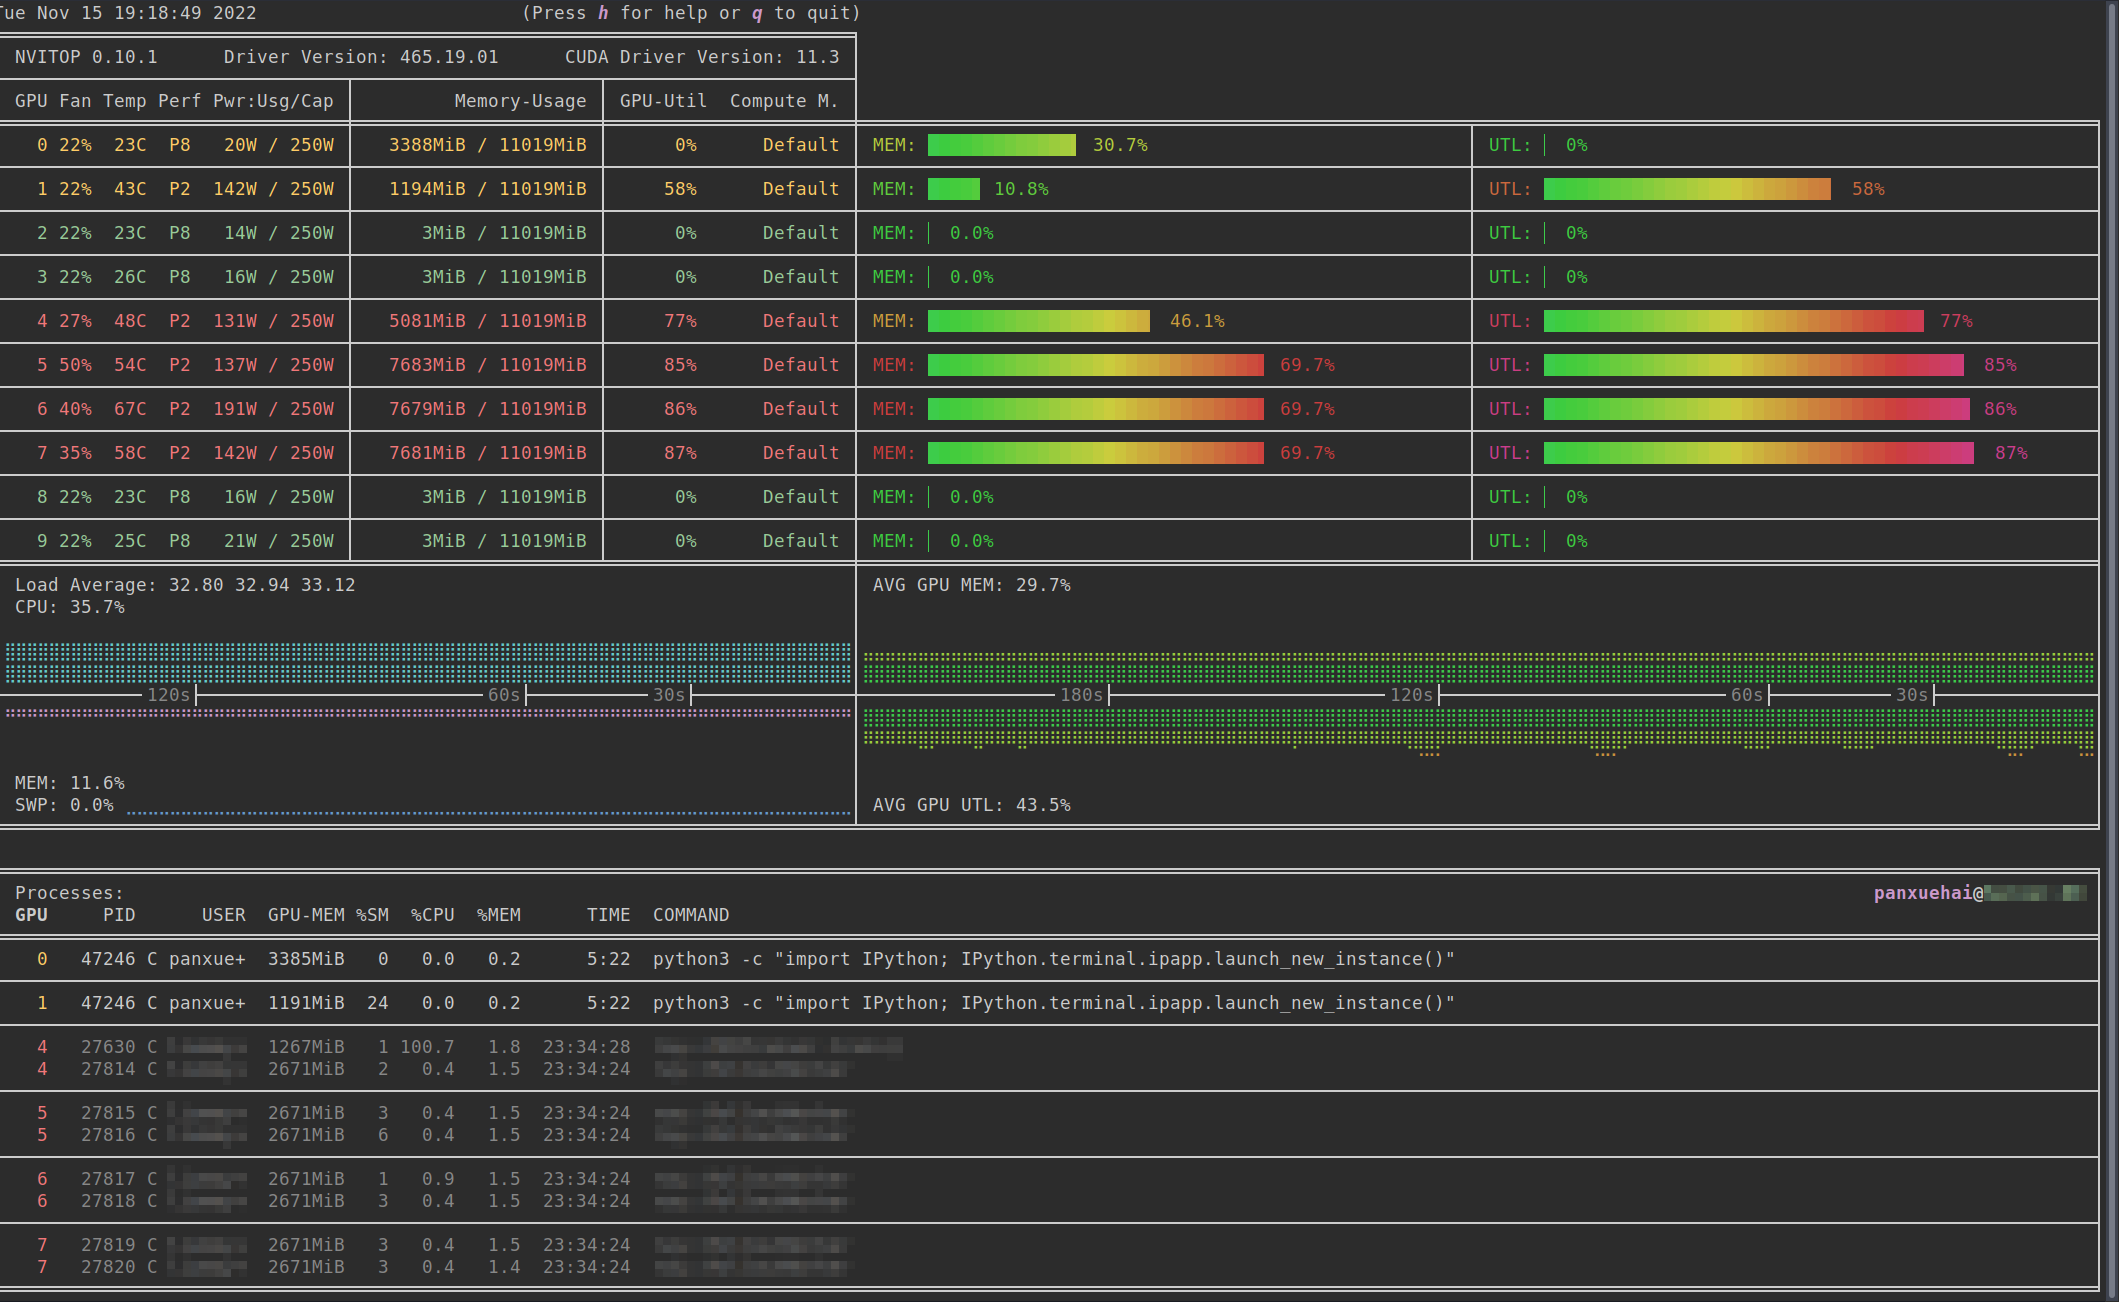
An interactive NVIDIA-GPU process viewer and beyond.
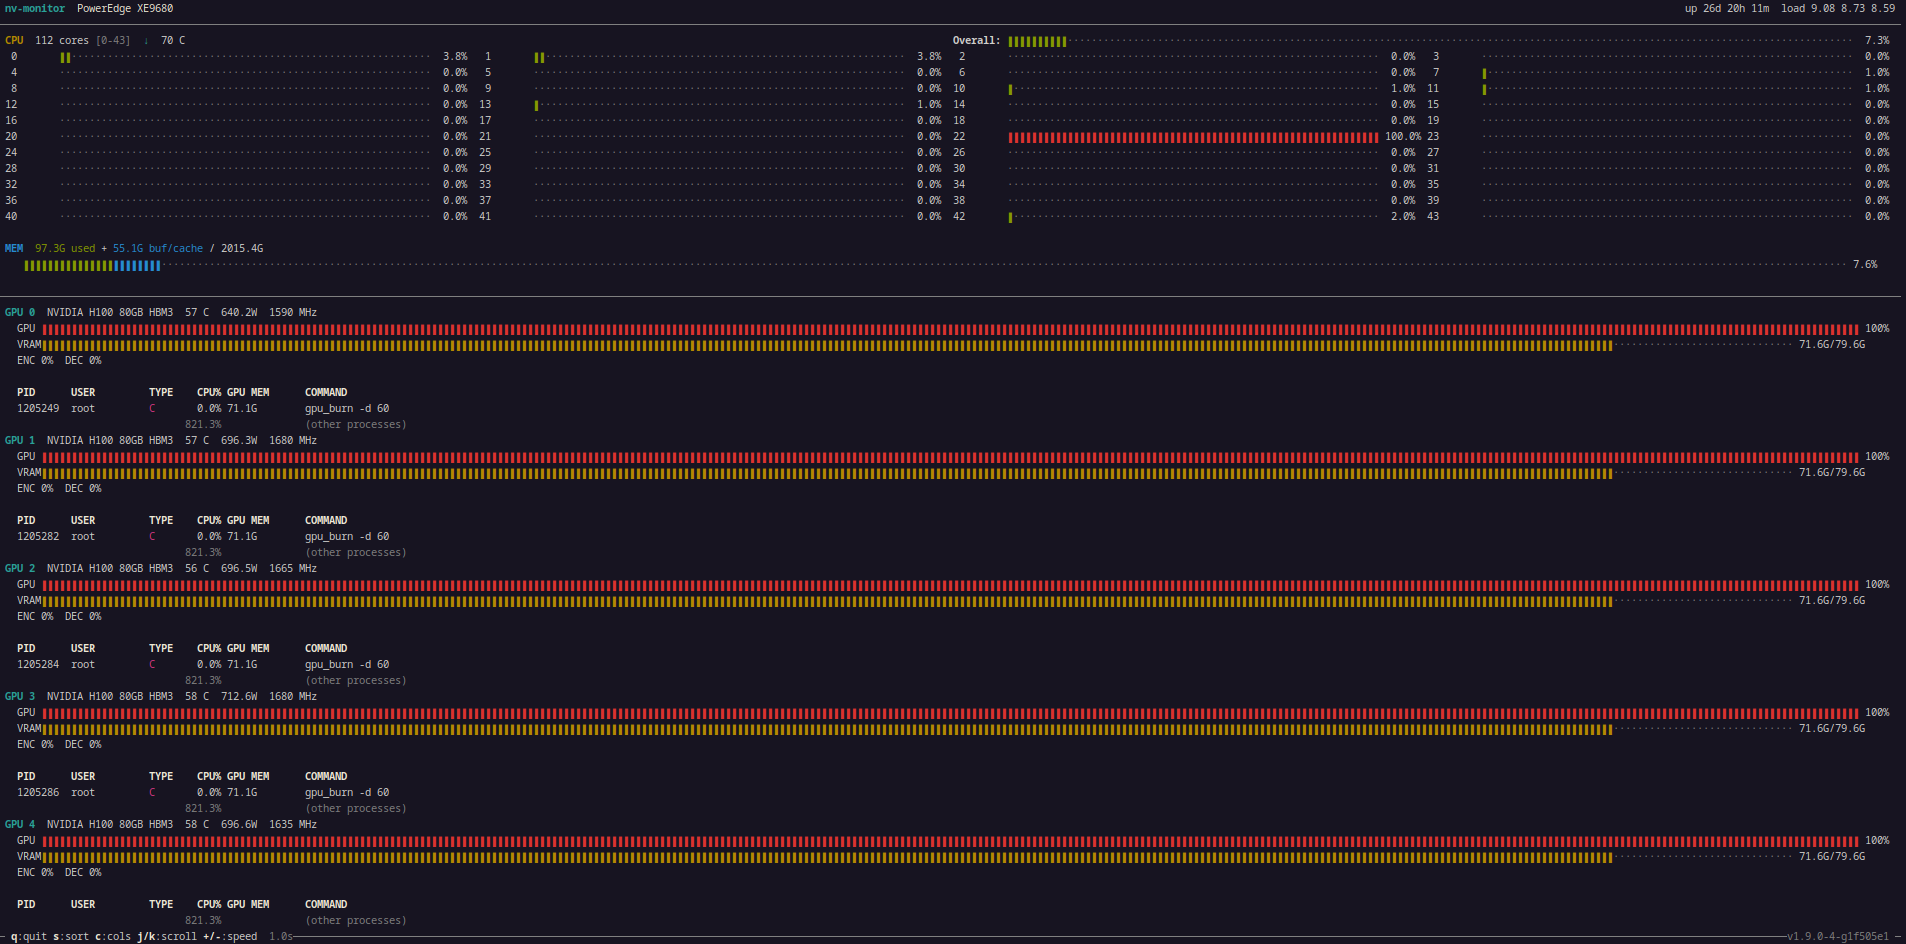
A low-level Nvidia GPU system monitor.
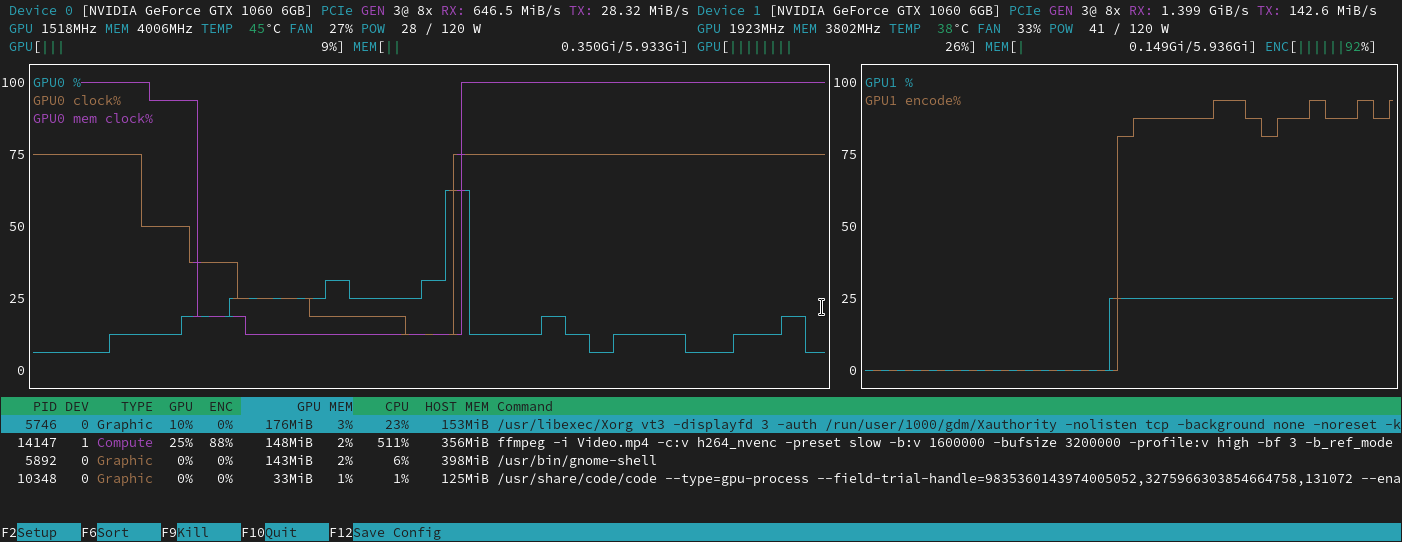
NVIDIA GPUs htop like monitoring tool
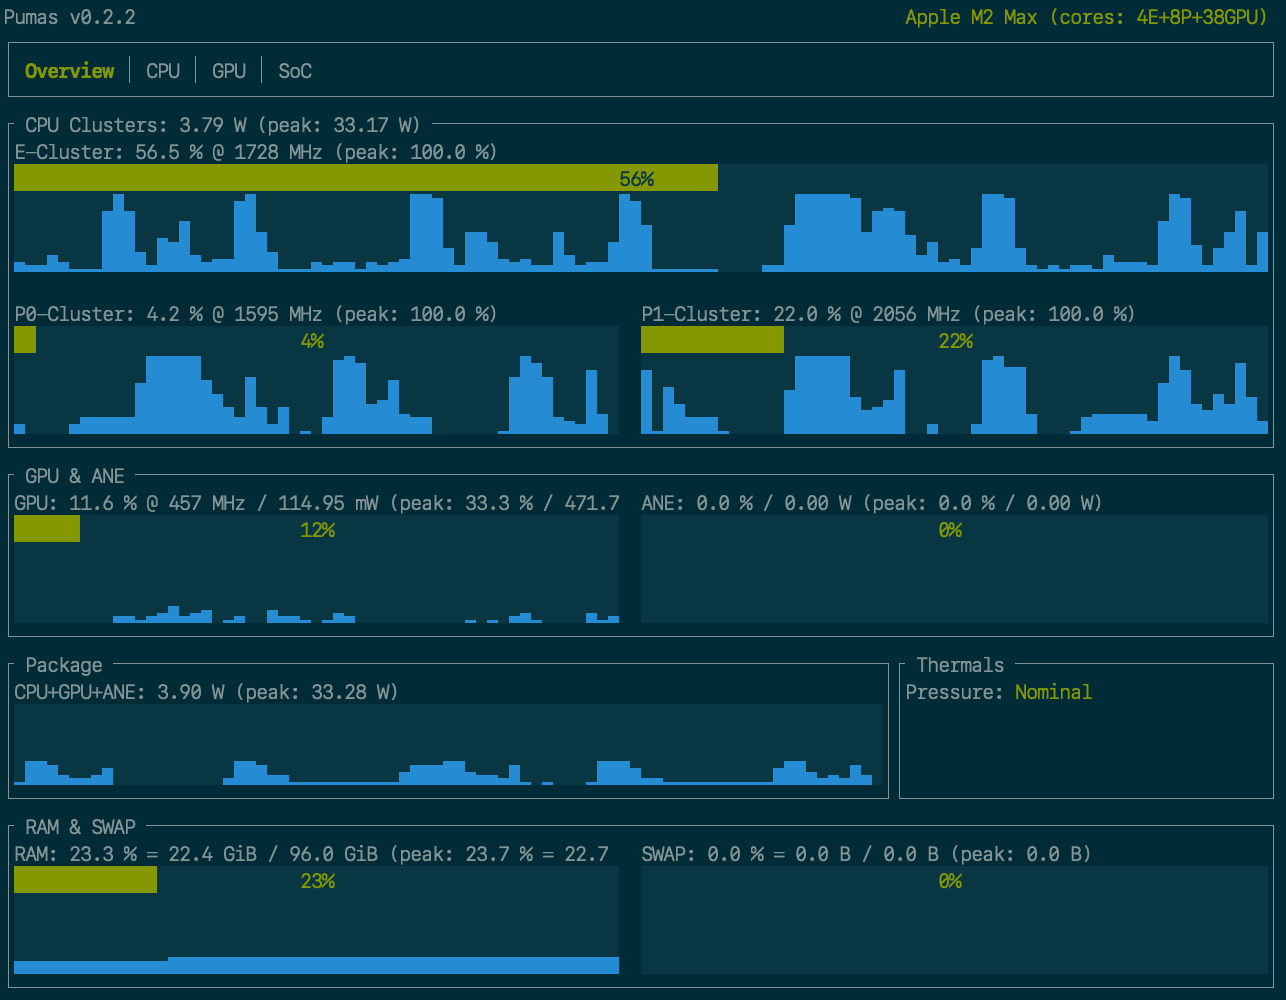
Power Usage Monitor for Apple Silicon.
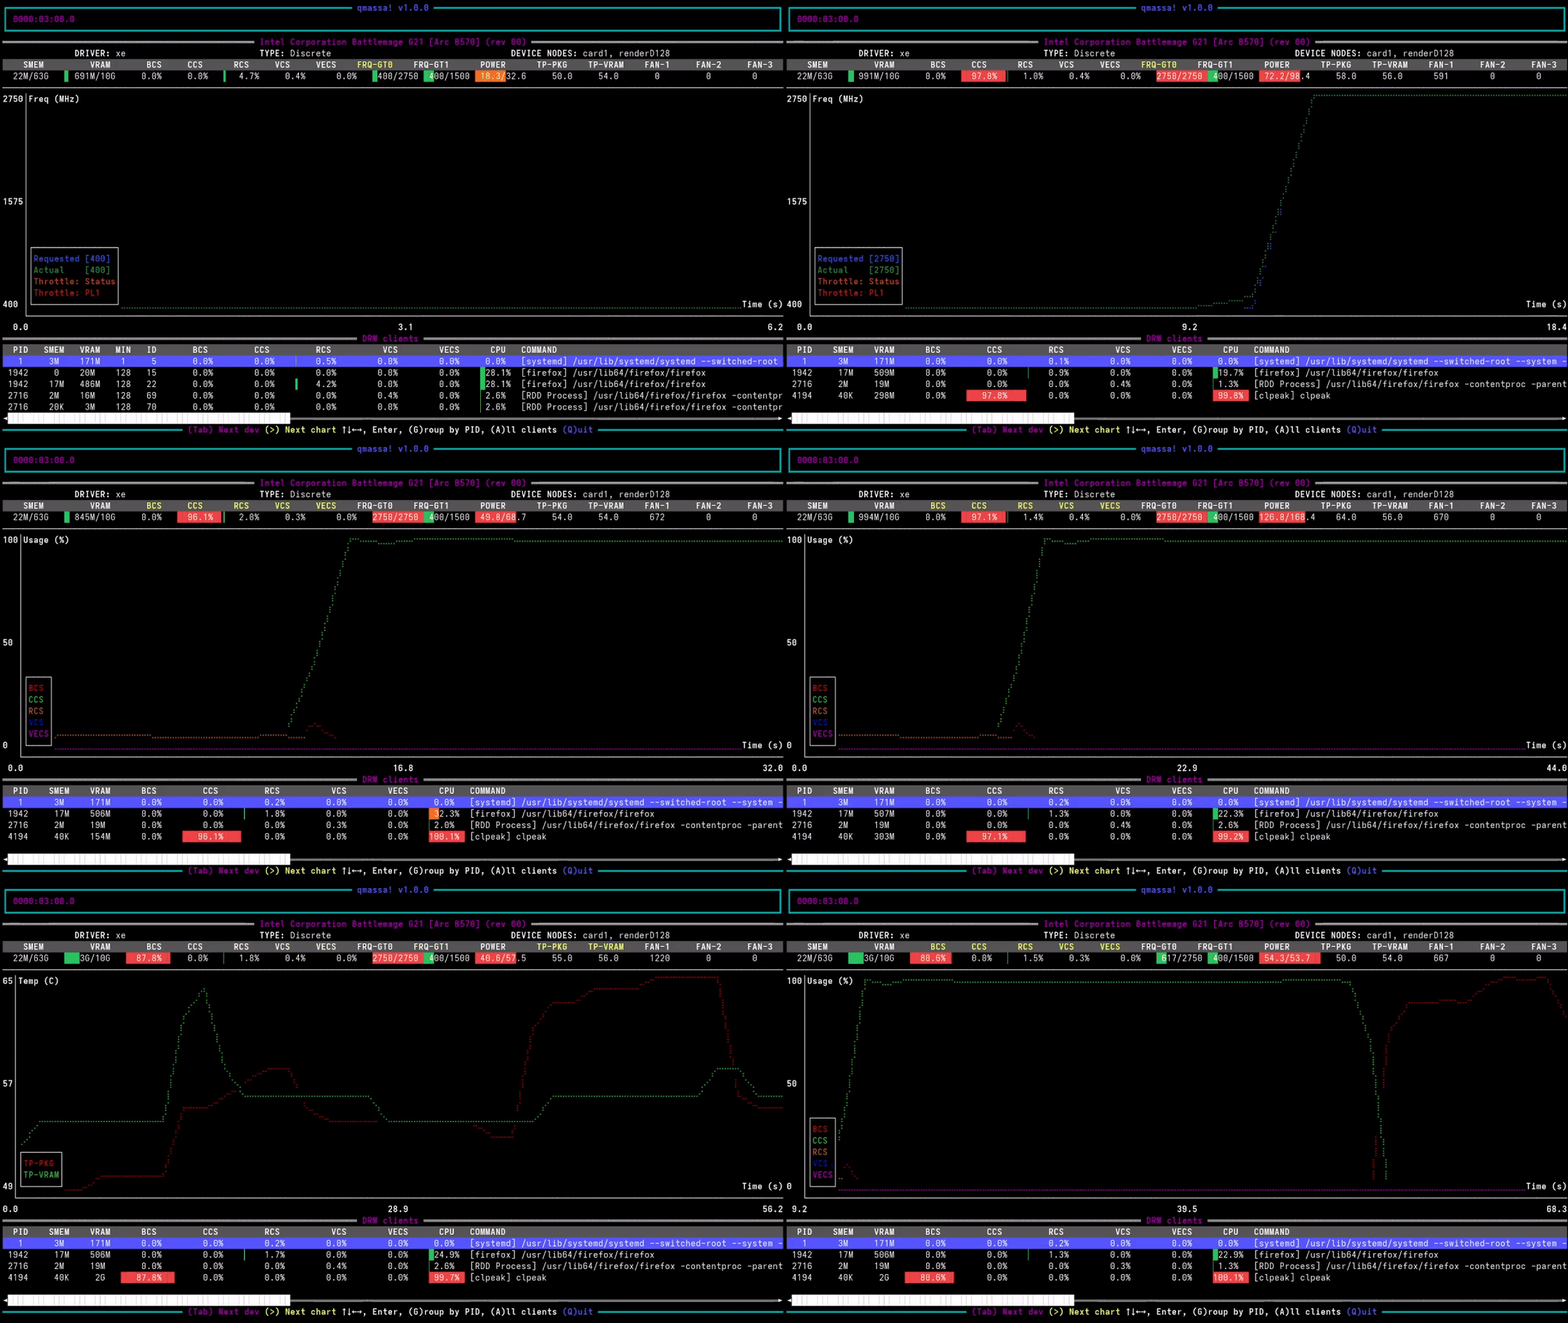
Terminal-based tool for displaying GPUs usage stats on Linux.
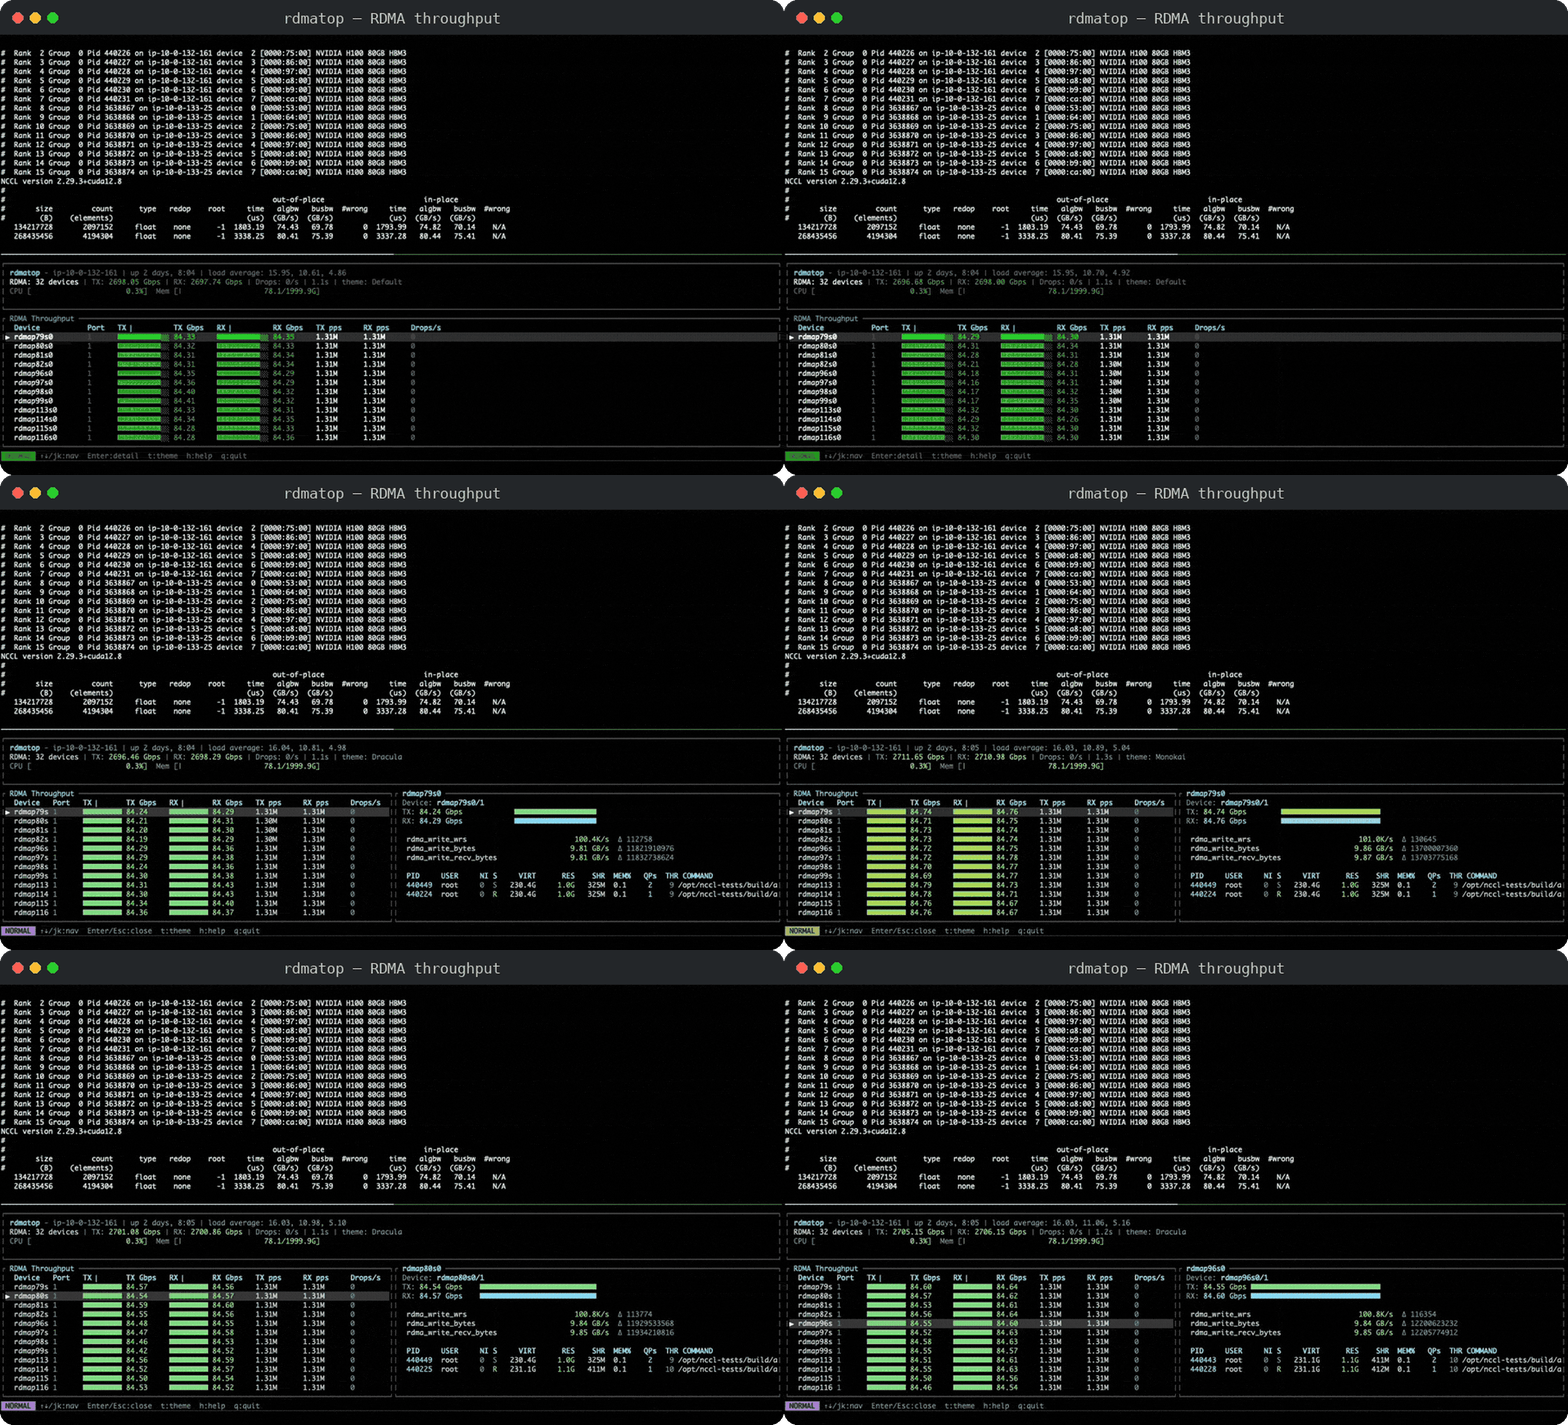
A real-time TUI monitor for RDMA network interfaces.
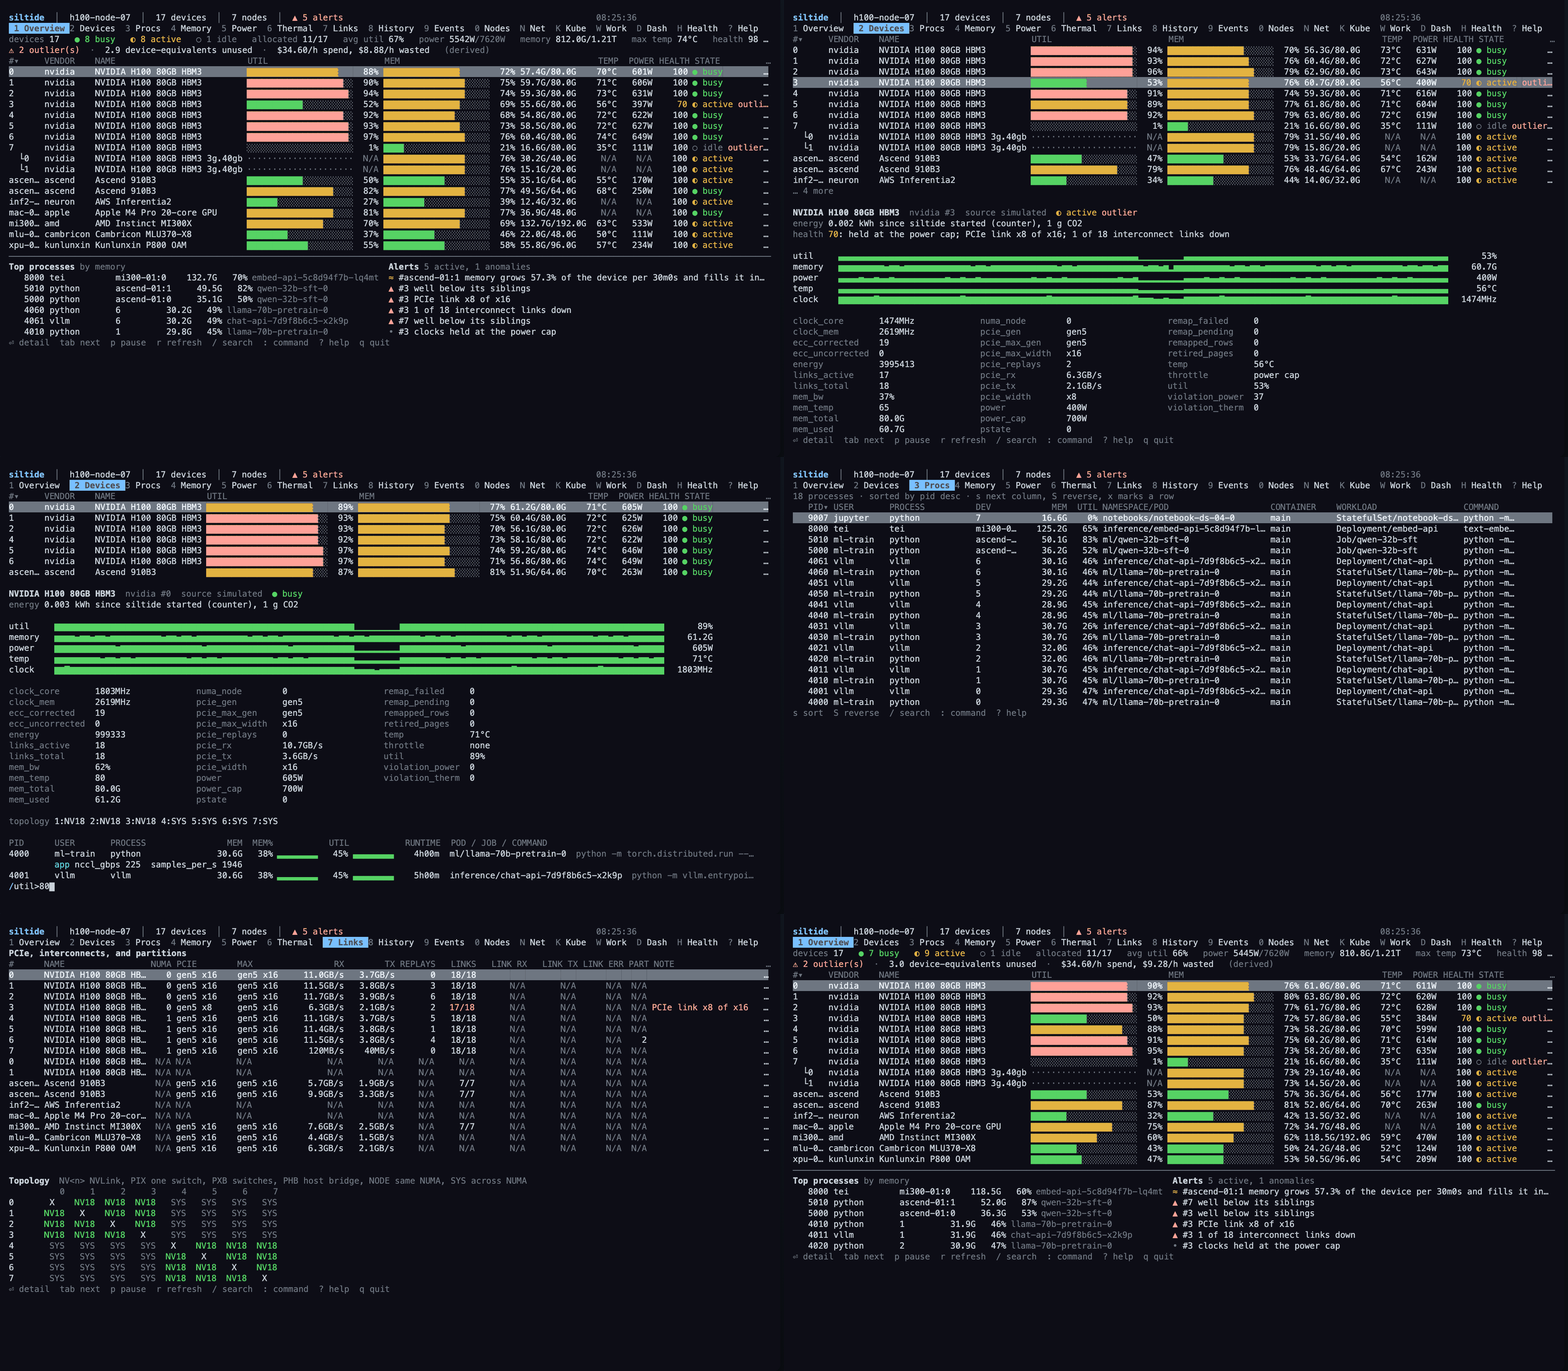
A terminal fleet monitor for GPUs, NPUs, and 13 other accelerator kinds.
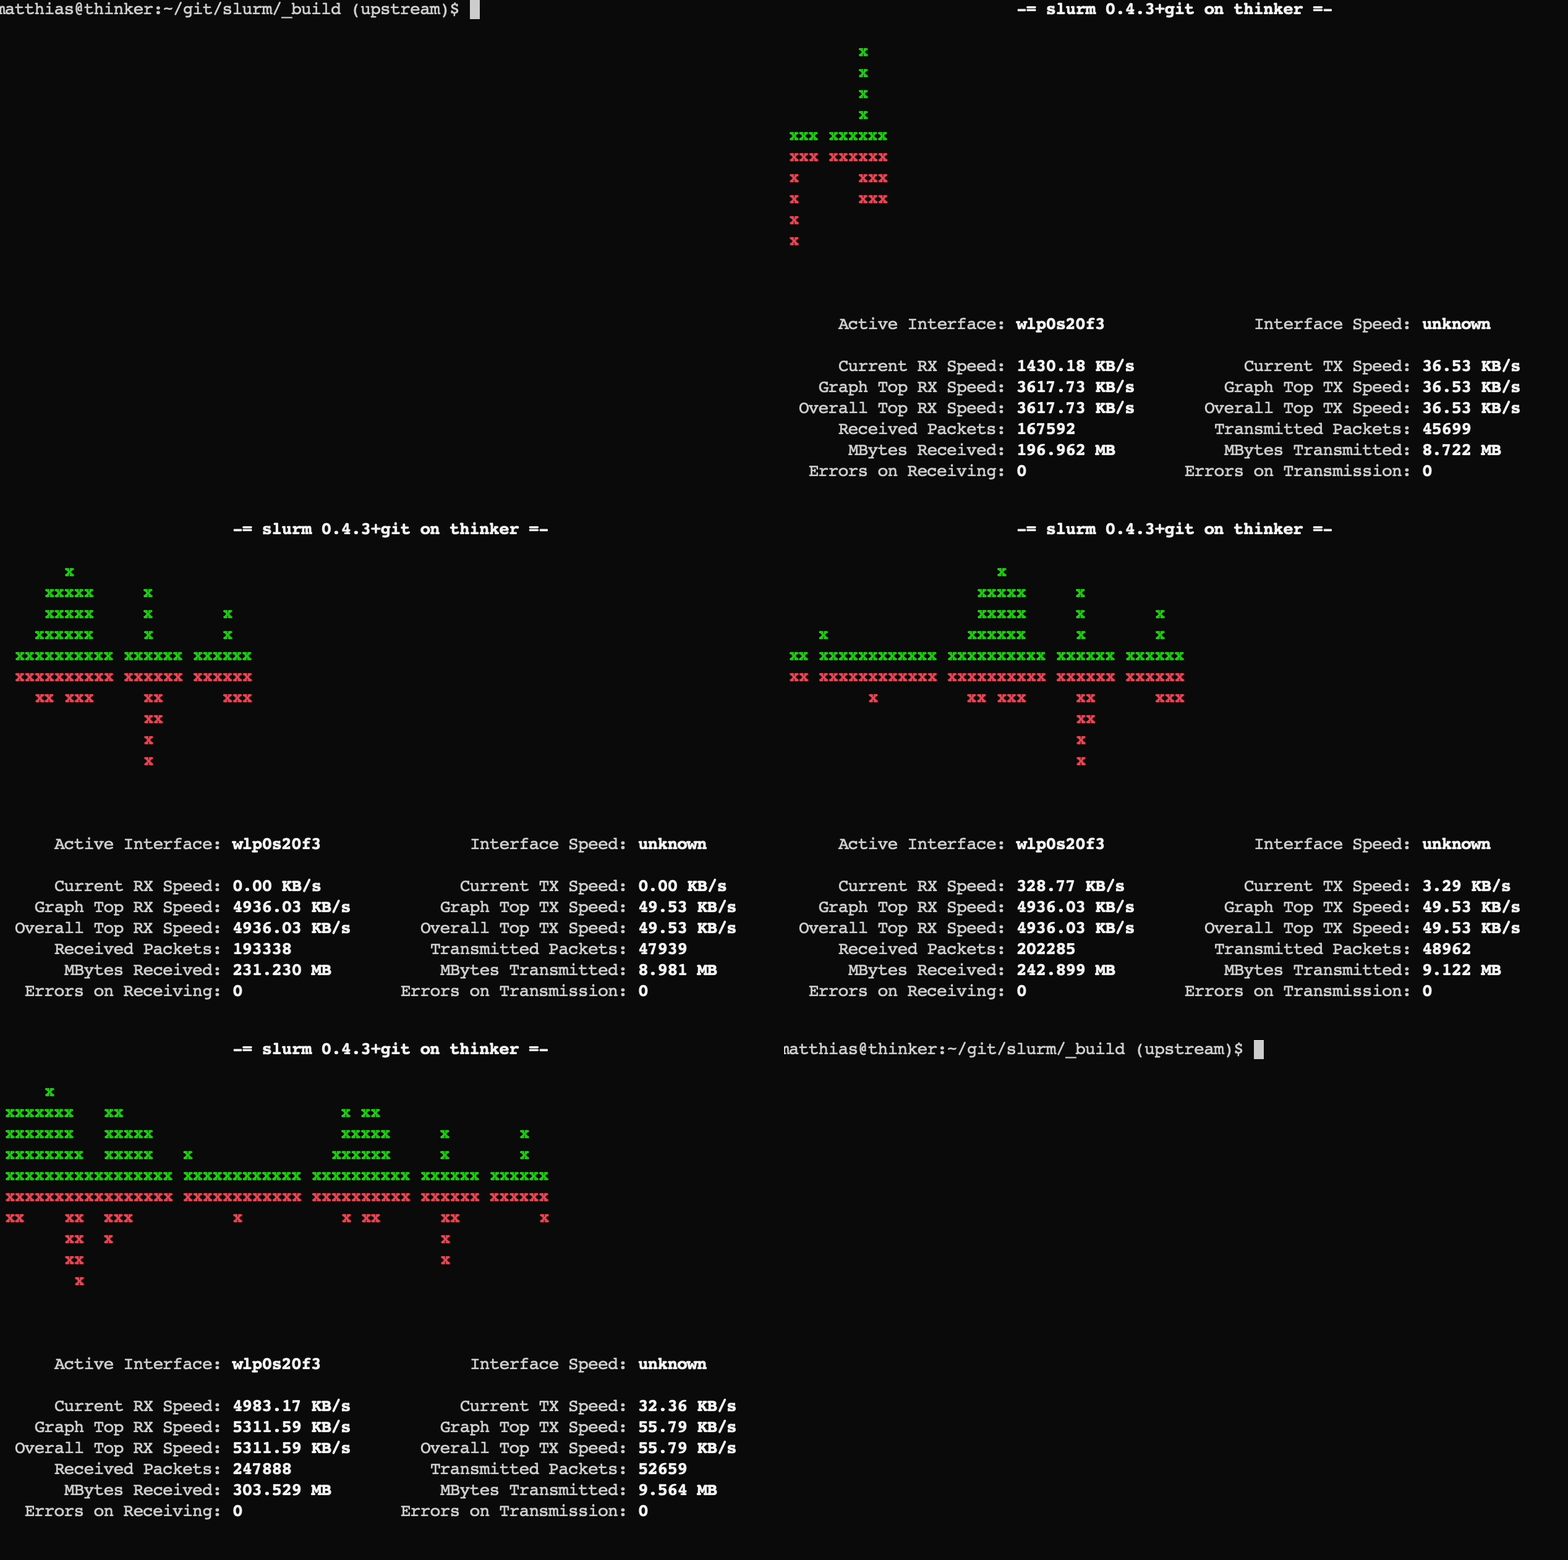
Realtime traffic statistics for network interfaces
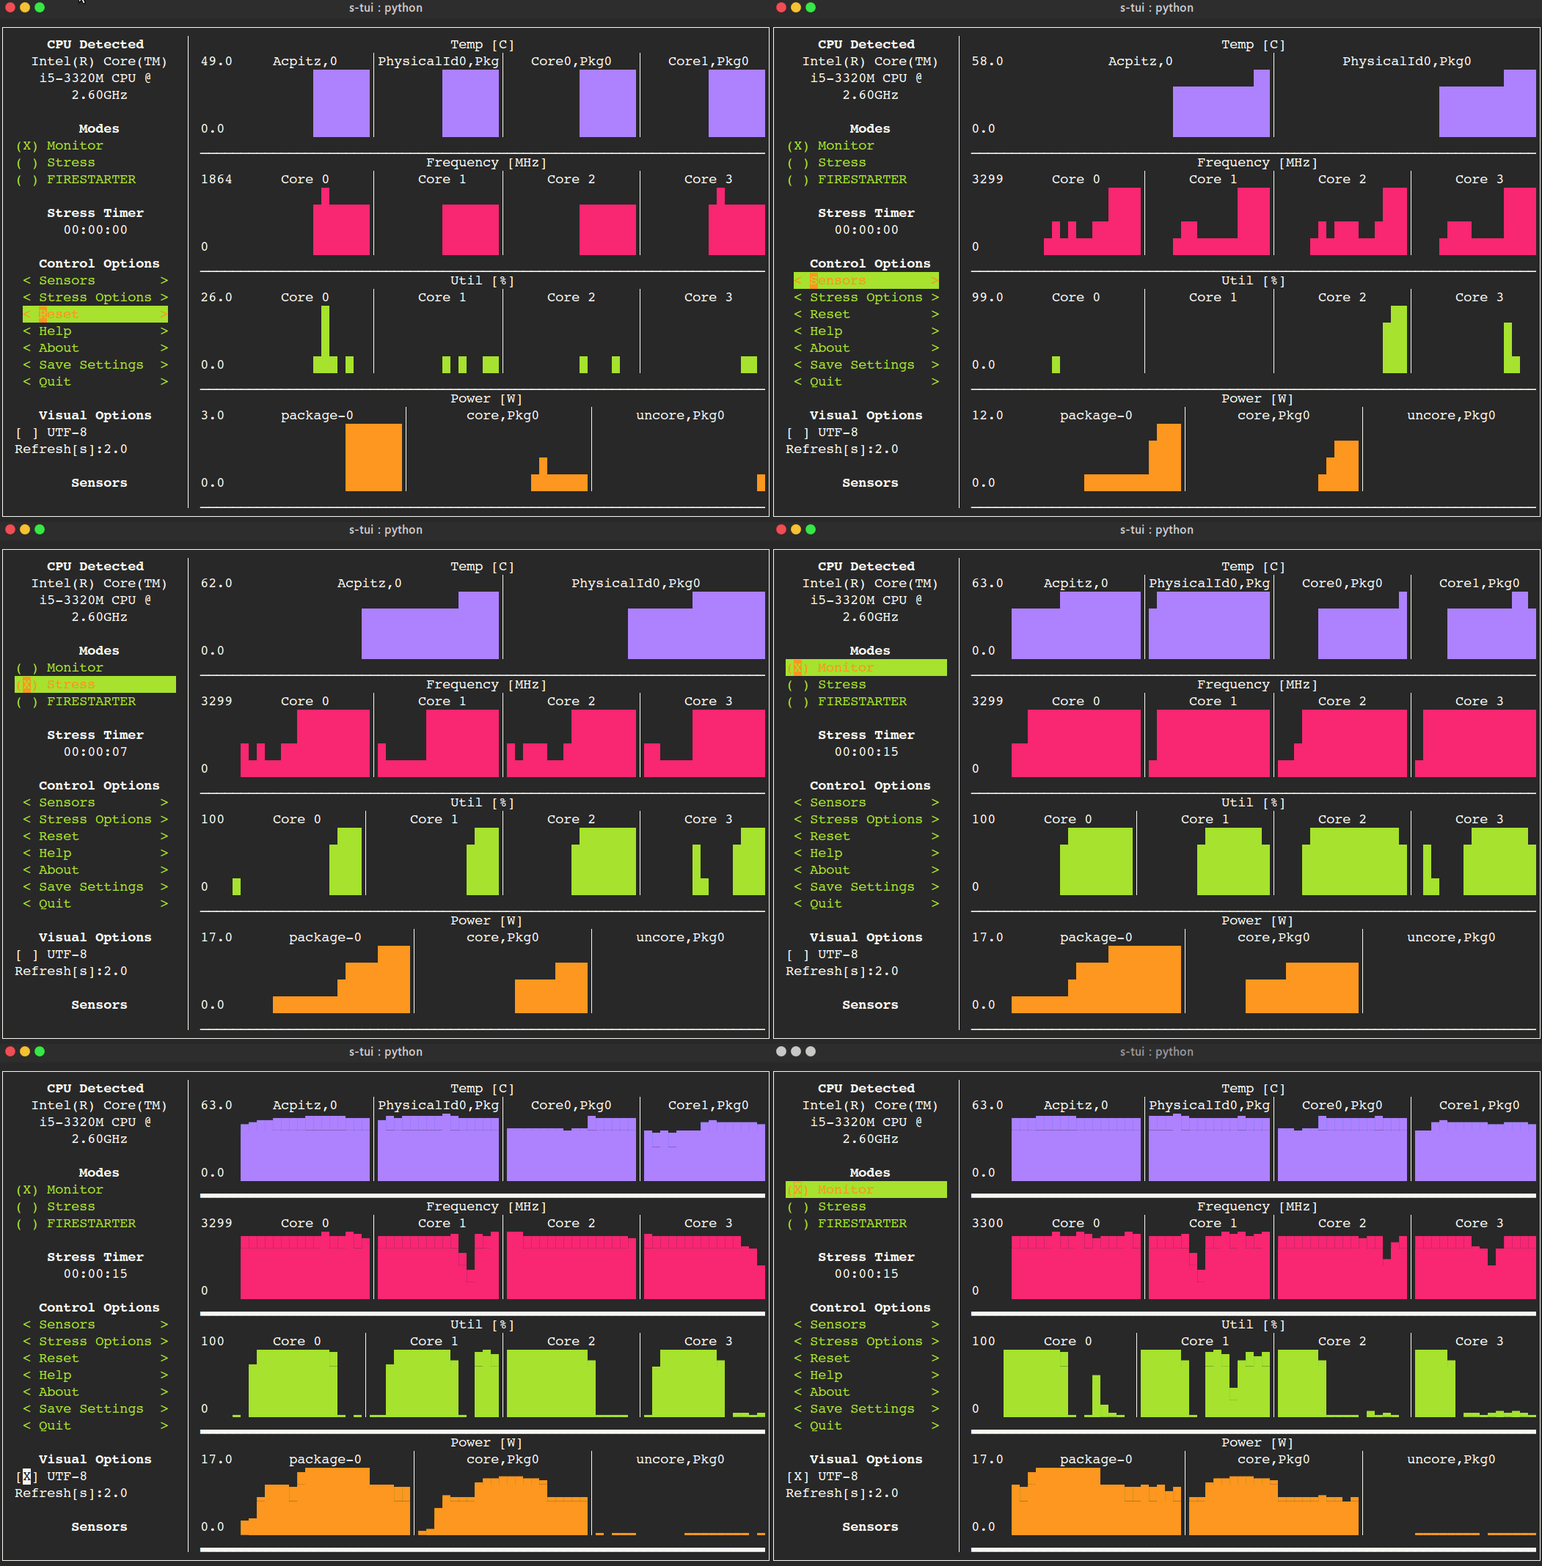
terminal-based CPU stress and monitoring utility.
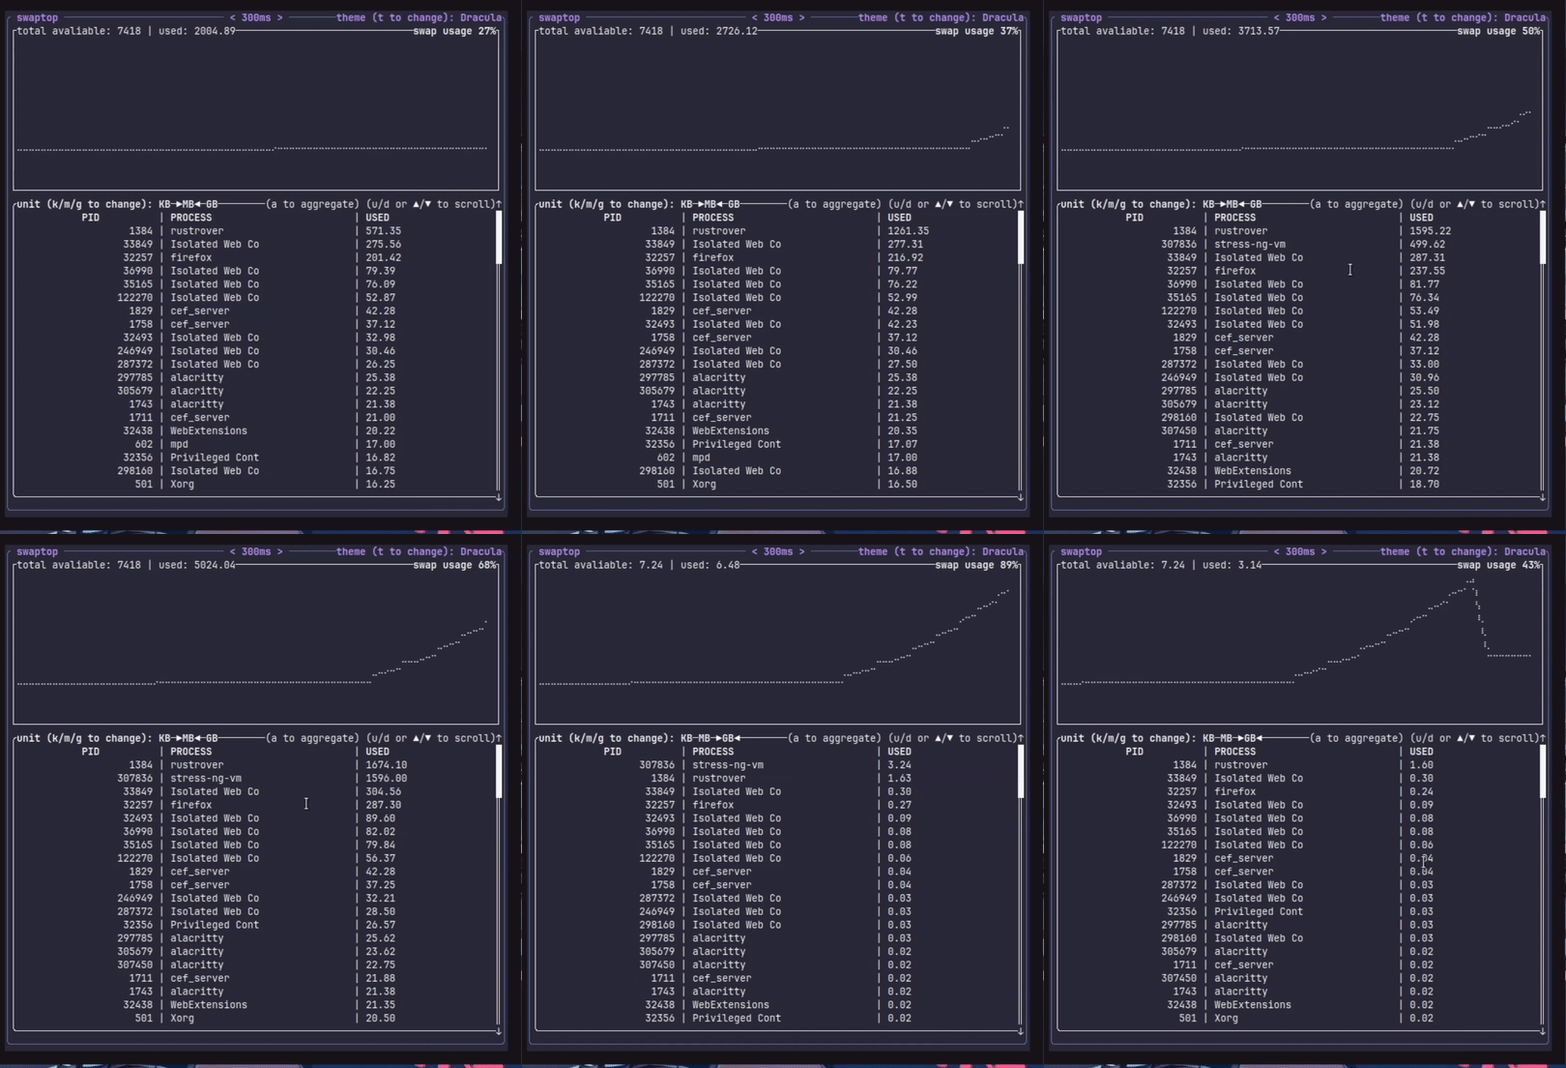
A real-time swap usage monitor with a TUI.
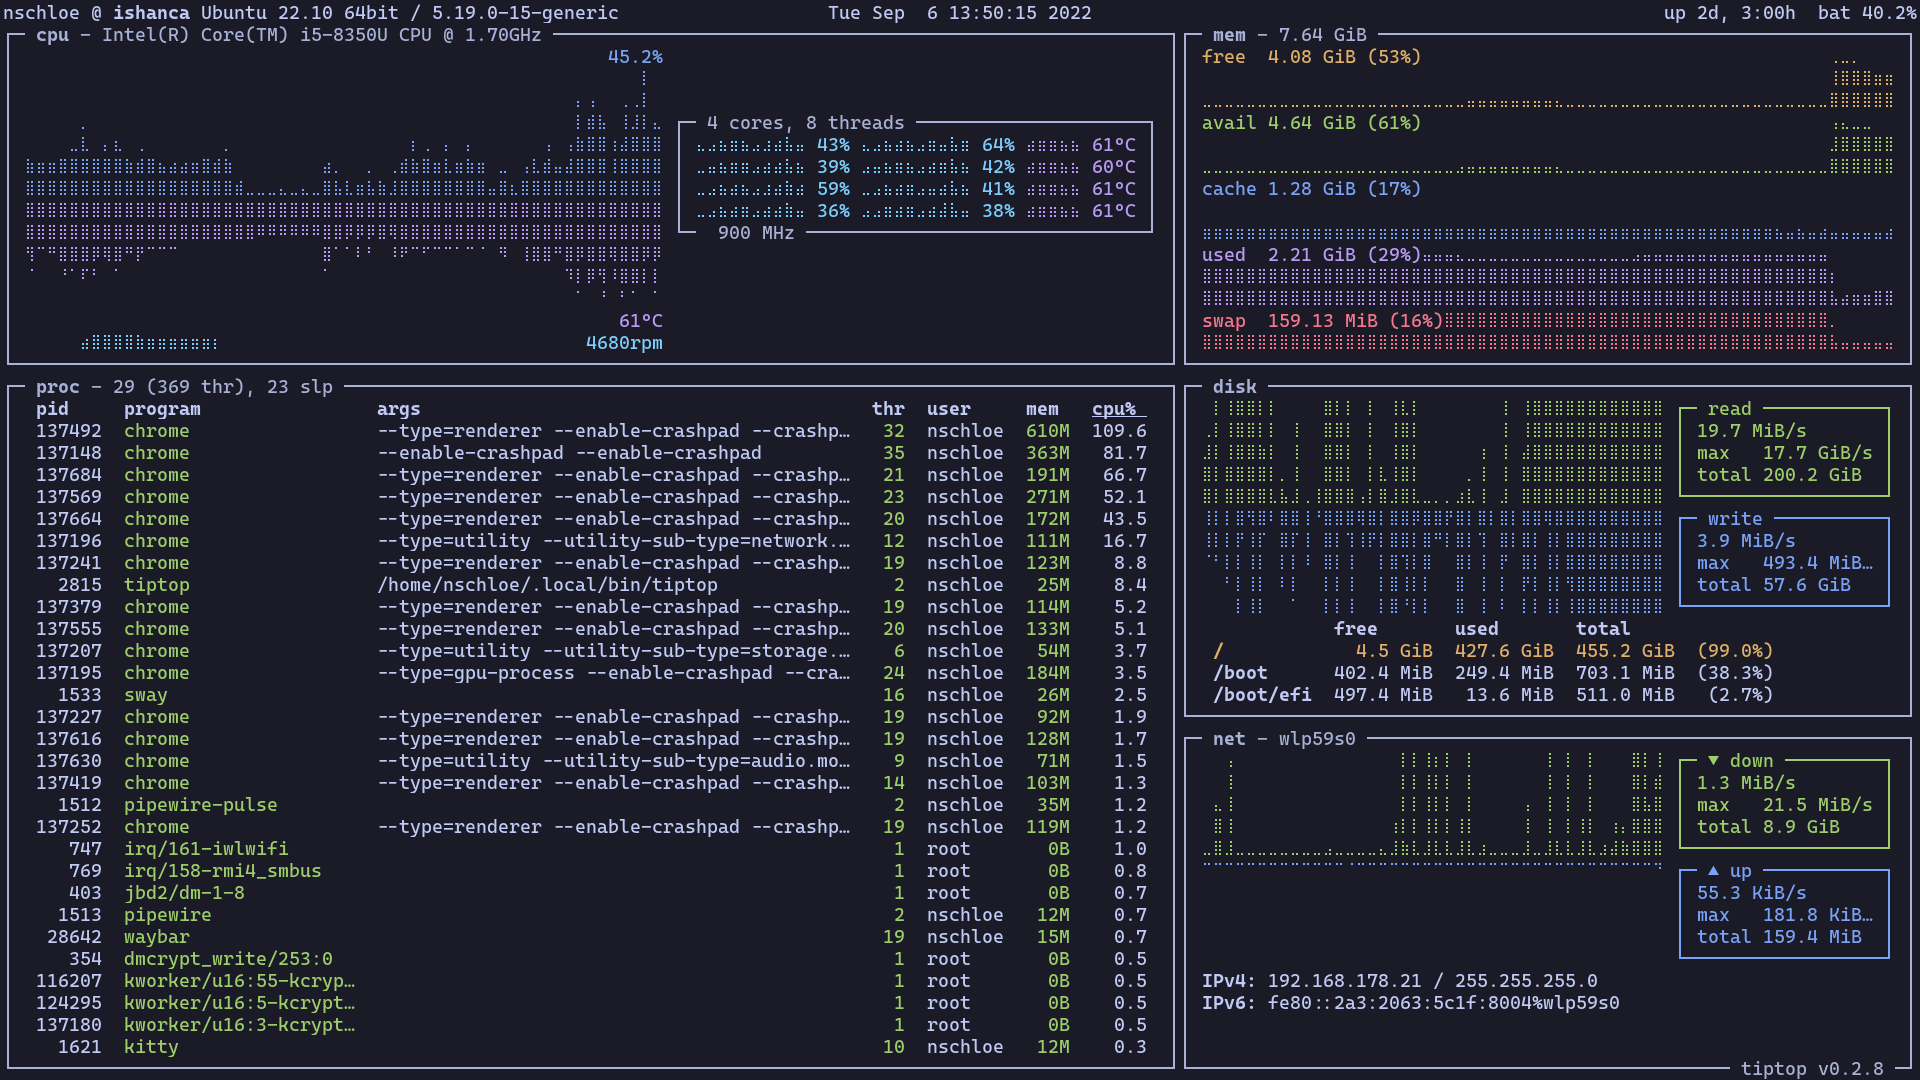
Command-line system monitoring
